Immigrants from Philippines vs Pakistani In Labor Force | Age 16-19
COMPARE
Immigrants from Philippines
Pakistani
In Labor Force | Age 16-19
In Labor Force | Age 16-19 Comparison
Immigrants from Philippines
Pakistanis
35.1%
IN LABOR FORCE | AGE 16-19
4.0/ 100
METRIC RATING
235th/ 347
METRIC RANK
37.6%
IN LABOR FORCE | AGE 16-19
89.5/ 100
METRIC RATING
143rd/ 347
METRIC RANK
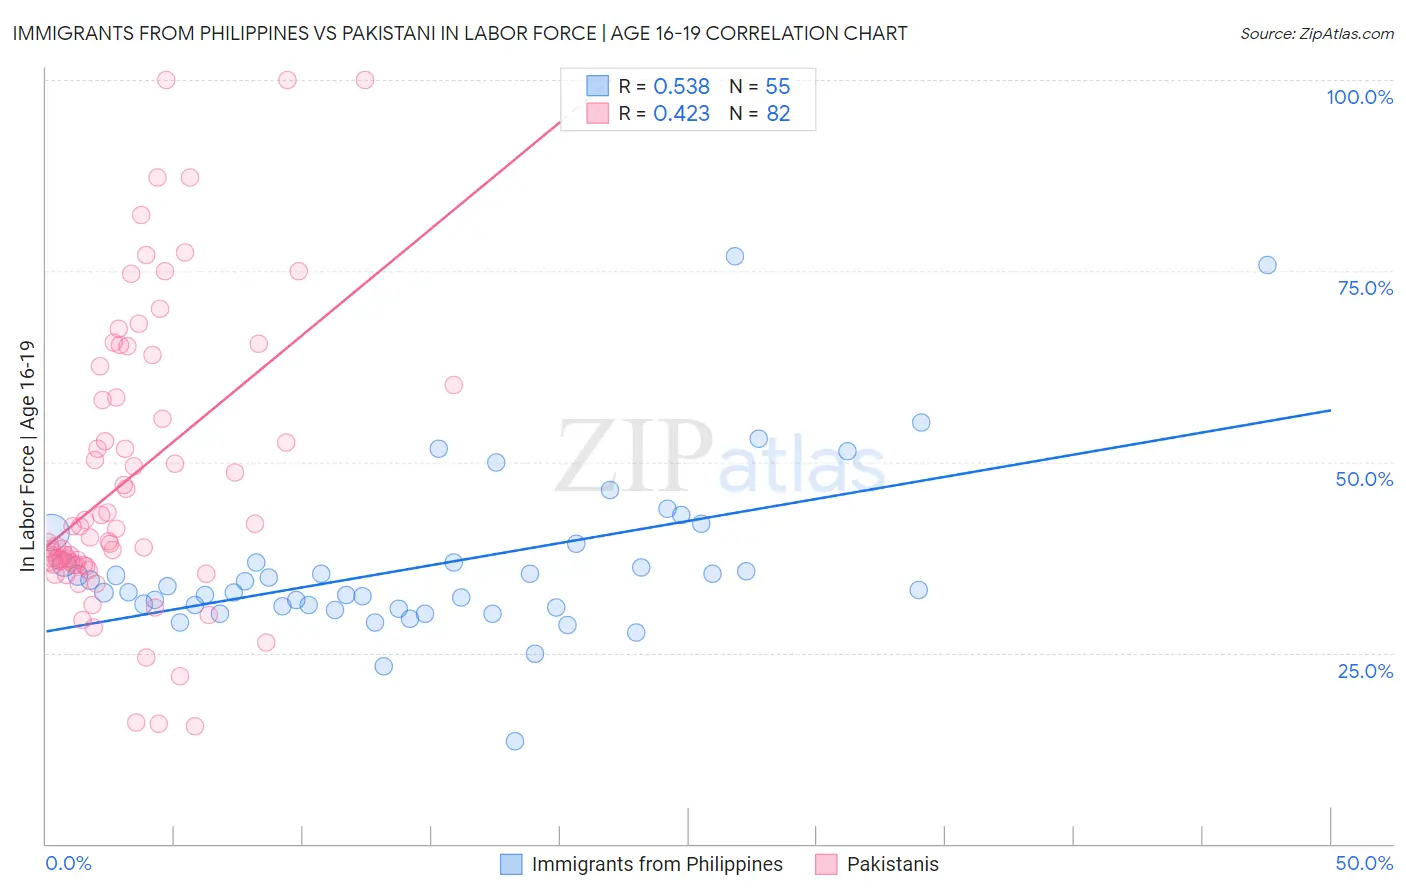
Immigrants from Philippines vs Pakistani In Labor Force | Age 16-19 Correlation Chart
The statistical analysis conducted on geographies consisting of 470,219,281 people shows a substantial positive correlation between the proportion of Immigrants from Philippines and labor force participation rate among population between the ages 16 and 19 in the United States with a correlation coefficient (R) of 0.538 and weighted average of 35.1%. Similarly, the statistical analysis conducted on geographies consisting of 335,000,628 people shows a moderate positive correlation between the proportion of Pakistanis and labor force participation rate among population between the ages 16 and 19 in the United States with a correlation coefficient (R) of 0.423 and weighted average of 37.6%, a difference of 7.0%.
In Labor Force | Age 16-19 Correlation Summary
| Measurement | Immigrants from Philippines | Pakistani |
| Minimum | 13.4% | 15.4% |
| Maximum | 76.9% | 100.0% |
| Range | 63.5% | 84.6% |
| Mean | 36.4% | 48.1% |
| Median | 33.2% | 40.7% |
| Interquartile 25% (IQ1) | 31.0% | 36.5% |
| Interquartile 75% (IQ3) | 36.8% | 60.0% |
| Interquartile Range (IQR) | 5.8% | 23.5% |
| Standard Deviation (Sample) | 10.8% | 19.2% |
| Standard Deviation (Population) | 10.7% | 19.1% |
Similar Demographics by In Labor Force | Age 16-19
Demographics Similar to Immigrants from Philippines by In Labor Force | Age 16-19
In terms of in labor force | age 16-19, the demographic groups most similar to Immigrants from Philippines are Immigrants from Mexico (35.1%, a difference of 0.080%), Immigrants from France (35.1%, a difference of 0.12%), Immigrants from Australia (35.1%, a difference of 0.14%), Immigrants from Syria (35.2%, a difference of 0.16%), and Immigrants from Kazakhstan (35.2%, a difference of 0.16%).
| Demographics | Rating | Rank | In Labor Force | Age 16-19 |
| Immigrants | Senegal | 5.5 /100 | #228 | Tragic 35.3% |
| Immigrants | Lebanon | 5.0 /100 | #229 | Tragic 35.2% |
| Immigrants | Honduras | 4.9 /100 | #230 | Tragic 35.2% |
| Immigrants | Syria | 4.5 /100 | #231 | Tragic 35.2% |
| Immigrants | Kazakhstan | 4.5 /100 | #232 | Tragic 35.2% |
| Immigrants | France | 4.3 /100 | #233 | Tragic 35.1% |
| Immigrants | Mexico | 4.2 /100 | #234 | Tragic 35.1% |
| Immigrants | Philippines | 4.0 /100 | #235 | Tragic 35.1% |
| Immigrants | Australia | 3.6 /100 | #236 | Tragic 35.1% |
| Immigrants | India | 3.5 /100 | #237 | Tragic 35.0% |
| Immigrants | Vietnam | 3.4 /100 | #238 | Tragic 35.0% |
| Inupiat | 3.2 /100 | #239 | Tragic 35.0% |
| Immigrants | Central America | 3.0 /100 | #240 | Tragic 35.0% |
| Immigrants | Ireland | 2.9 /100 | #241 | Tragic 35.0% |
| Uruguayans | 2.6 /100 | #242 | Tragic 34.9% |
Demographics Similar to Pakistanis by In Labor Force | Age 16-19
In terms of in labor force | age 16-19, the demographic groups most similar to Pakistanis are Japanese (37.5%, a difference of 0.020%), Paiute (37.5%, a difference of 0.020%), Sierra Leonean (37.6%, a difference of 0.030%), Immigrants from Western Europe (37.5%, a difference of 0.070%), and Brazilian (37.5%, a difference of 0.10%).
| Demographics | Rating | Rank | In Labor Force | Age 16-19 |
| Australians | 93.2 /100 | #136 | Exceptional 37.8% |
| Cajuns | 93.2 /100 | #137 | Exceptional 37.8% |
| Comanche | 91.9 /100 | #138 | Exceptional 37.7% |
| Immigrants | Moldova | 91.9 /100 | #139 | Exceptional 37.7% |
| Estonians | 91.7 /100 | #140 | Exceptional 37.7% |
| Syrians | 90.7 /100 | #141 | Exceptional 37.6% |
| Sierra Leoneans | 89.7 /100 | #142 | Excellent 37.6% |
| Pakistanis | 89.5 /100 | #143 | Excellent 37.6% |
| Japanese | 89.3 /100 | #144 | Excellent 37.5% |
| Paiute | 89.3 /100 | #145 | Excellent 37.5% |
| Immigrants | Western Europe | 88.9 /100 | #146 | Excellent 37.5% |
| Brazilians | 88.7 /100 | #147 | Excellent 37.5% |
| Romanians | 87.3 /100 | #148 | Excellent 37.5% |
| Native Hawaiians | 85.0 /100 | #149 | Excellent 37.4% |
| Tsimshian | 84.7 /100 | #150 | Excellent 37.4% |