Immigrants from Philippines vs Filipino 1st Grade
COMPARE
Immigrants from Philippines
Filipino
1st Grade
1st Grade Comparison
Immigrants from Philippines
Filipinos
97.4%
1ST GRADE
0.1/ 100
METRIC RATING
276th/ 347
METRIC RANK
98.0%
1ST GRADE
77.6/ 100
METRIC RATING
147th/ 347
METRIC RANK
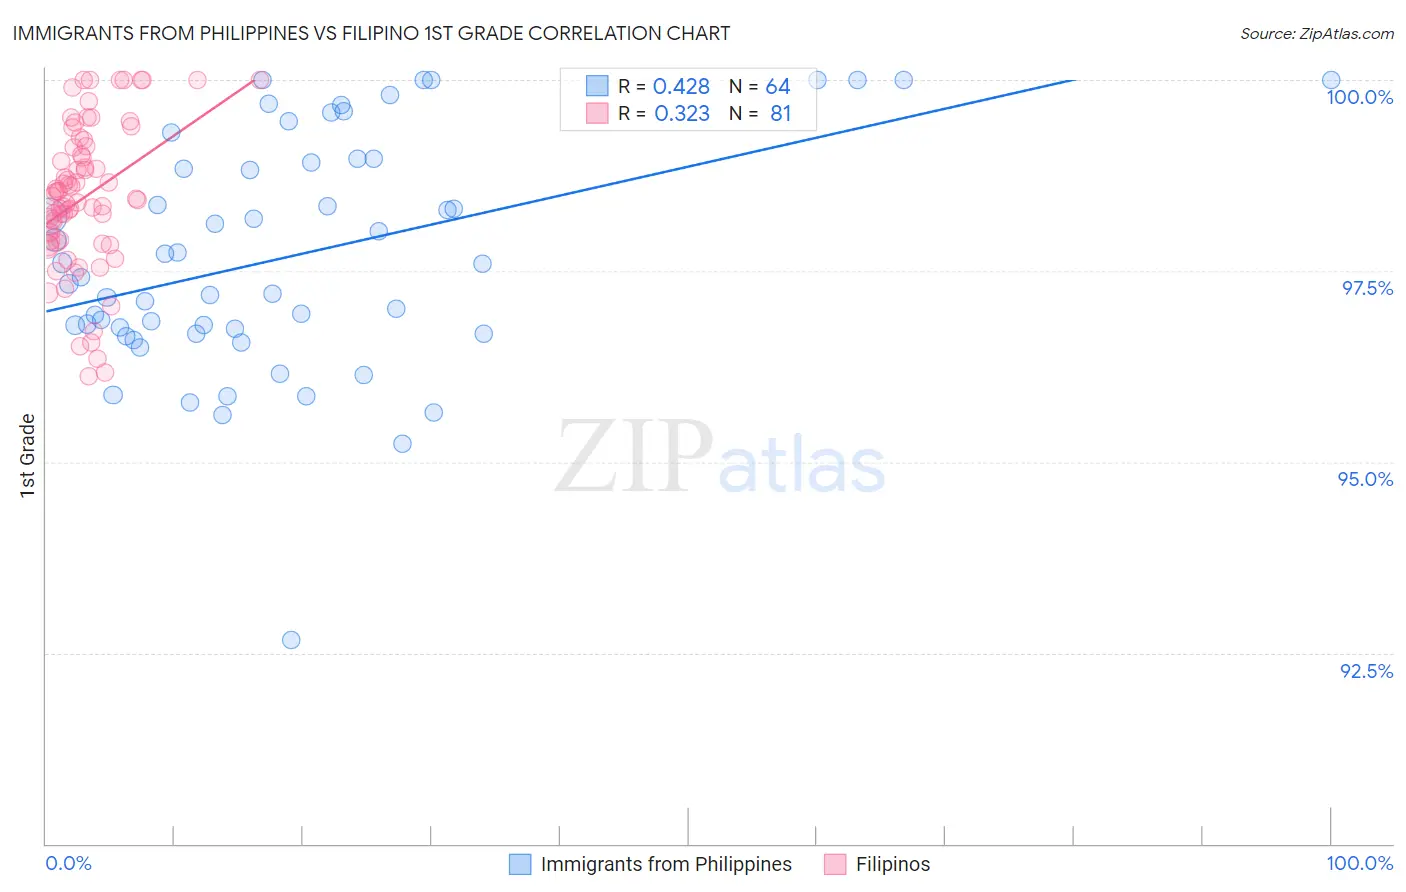
Immigrants from Philippines vs Filipino 1st Grade Correlation Chart
The statistical analysis conducted on geographies consisting of 471,303,140 people shows a moderate positive correlation between the proportion of Immigrants from Philippines and percentage of population with at least 1st grade education in the United States with a correlation coefficient (R) of 0.428 and weighted average of 97.4%. Similarly, the statistical analysis conducted on geographies consisting of 254,351,427 people shows a mild positive correlation between the proportion of Filipinos and percentage of population with at least 1st grade education in the United States with a correlation coefficient (R) of 0.323 and weighted average of 98.0%, a difference of 0.65%.
1st Grade Correlation Summary
| Measurement | Immigrants from Philippines | Filipino |
| Minimum | 92.7% | 96.1% |
| Maximum | 100.0% | 100.0% |
| Range | 7.3% | 3.9% |
| Mean | 97.7% | 98.5% |
| Median | 97.5% | 98.4% |
| Interquartile 25% (IQ1) | 96.7% | 97.9% |
| Interquartile 75% (IQ3) | 98.9% | 99.1% |
| Interquartile Range (IQR) | 2.2% | 1.2% |
| Standard Deviation (Sample) | 1.5% | 0.95% |
| Standard Deviation (Population) | 1.5% | 0.94% |
Similar Demographics by 1st Grade
Demographics Similar to Immigrants from Philippines by 1st Grade
In terms of 1st grade, the demographic groups most similar to Immigrants from Philippines are Immigrants from Western Africa (97.4%, a difference of 0.010%), Ghanaian (97.4%, a difference of 0.020%), Immigrants from China (97.4%, a difference of 0.020%), Immigrants from Uzbekistan (97.4%, a difference of 0.030%), and Immigrants from Ghana (97.4%, a difference of 0.030%).
| Demographics | Rating | Rank | 1st Grade |
| West Indians | 0.3 /100 | #269 | Tragic 97.5% |
| Immigrants | Jamaica | 0.2 /100 | #270 | Tragic 97.5% |
| Immigrants | Cameroon | 0.2 /100 | #271 | Tragic 97.4% |
| Immigrants | Peru | 0.2 /100 | #272 | Tragic 97.4% |
| Immigrants | Bolivia | 0.2 /100 | #273 | Tragic 97.4% |
| Ghanaians | 0.1 /100 | #274 | Tragic 97.4% |
| Immigrants | China | 0.1 /100 | #275 | Tragic 97.4% |
| Immigrants | Philippines | 0.1 /100 | #276 | Tragic 97.4% |
| Immigrants | Western Africa | 0.1 /100 | #277 | Tragic 97.4% |
| Immigrants | Uzbekistan | 0.1 /100 | #278 | Tragic 97.4% |
| Immigrants | Ghana | 0.1 /100 | #279 | Tragic 97.4% |
| Afghans | 0.1 /100 | #280 | Tragic 97.4% |
| Trinidadians and Tobagonians | 0.1 /100 | #281 | Tragic 97.3% |
| Barbadians | 0.1 /100 | #282 | Tragic 97.3% |
| Immigrants | West Indies | 0.0 /100 | #283 | Tragic 97.3% |
Demographics Similar to Filipinos by 1st Grade
In terms of 1st grade, the demographic groups most similar to Filipinos are Immigrants from Israel (98.0%, a difference of 0.0%), Hmong (98.0%, a difference of 0.010%), Apache (98.0%, a difference of 0.010%), Immigrants from Greece (98.0%, a difference of 0.010%), and Marshallese (98.0%, a difference of 0.020%).
| Demographics | Rating | Rank | 1st Grade |
| Palestinians | 83.0 /100 | #140 | Excellent 98.0% |
| Immigrants | Turkey | 82.8 /100 | #141 | Excellent 98.0% |
| Marshallese | 82.0 /100 | #142 | Excellent 98.0% |
| Burmese | 81.0 /100 | #143 | Excellent 98.0% |
| Alsatians | 80.9 /100 | #144 | Excellent 98.0% |
| Hmong | 79.0 /100 | #145 | Good 98.0% |
| Immigrants | Israel | 77.8 /100 | #146 | Good 98.0% |
| Filipinos | 77.6 /100 | #147 | Good 98.0% |
| Apache | 75.2 /100 | #148 | Good 98.0% |
| Immigrants | Greece | 74.9 /100 | #149 | Good 98.0% |
| Jordanians | 72.7 /100 | #150 | Good 98.0% |
| Dutch West Indians | 69.8 /100 | #151 | Good 98.0% |
| Immigrants | Moldova | 69.5 /100 | #152 | Good 98.0% |
| Soviet Union | 68.9 /100 | #153 | Good 98.0% |
| Immigrants | Iran | 66.9 /100 | #154 | Good 98.0% |