Immigrants from Scotland vs Filipino Male Disability
COMPARE
Immigrants from Scotland
Filipino
Male Disability
Male Disability Comparison
Immigrants from Scotland
Filipinos
11.6%
MALE DISABILITY
8.2/ 100
METRIC RATING
212th/ 347
METRIC RANK
9.1%
MALE DISABILITY
100.0/ 100
METRIC RATING
3rd/ 347
METRIC RANK
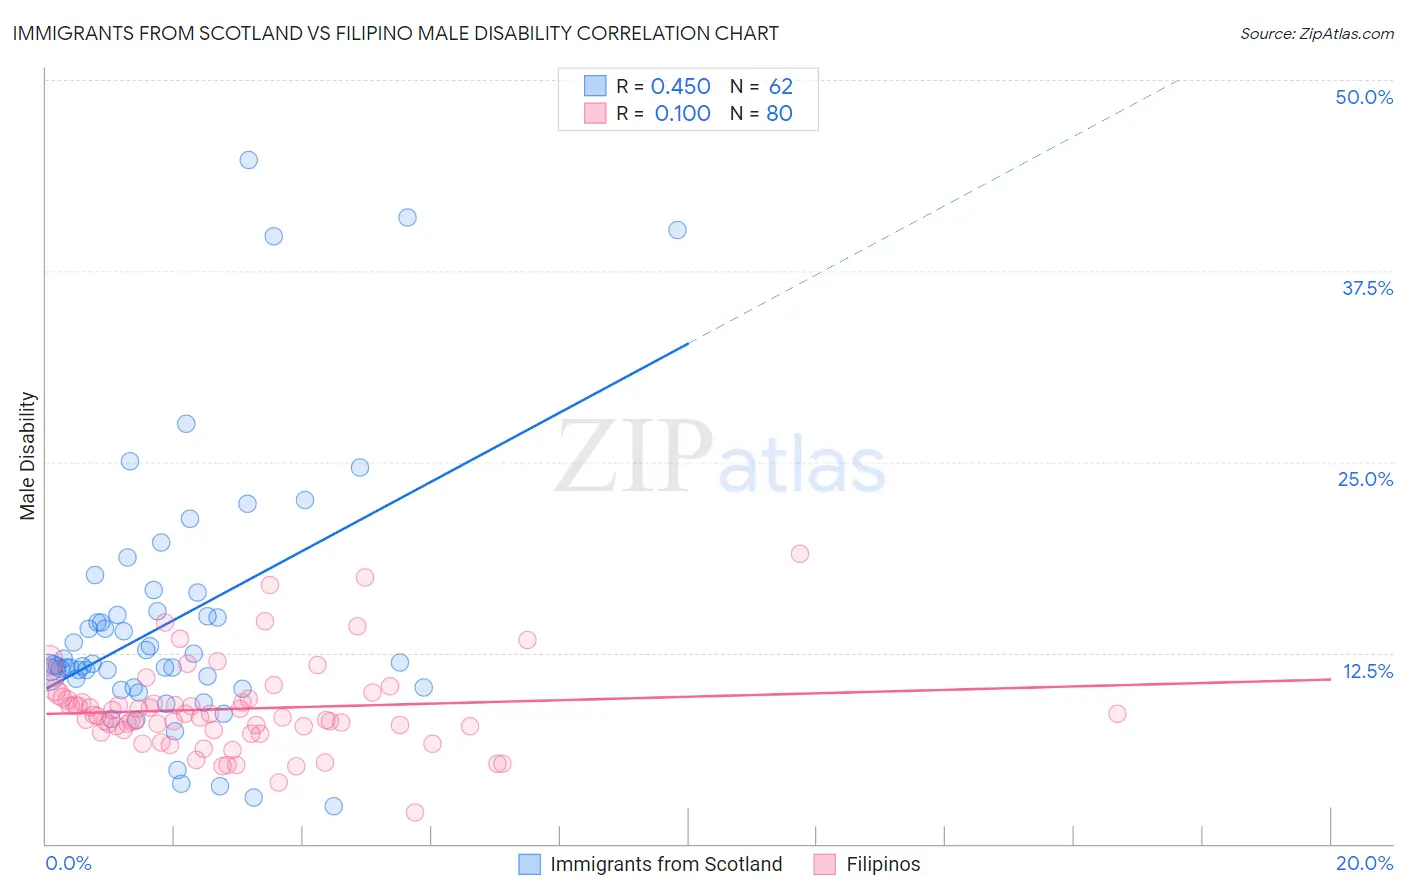
Immigrants from Scotland vs Filipino Male Disability Correlation Chart
The statistical analysis conducted on geographies consisting of 196,397,842 people shows a moderate positive correlation between the proportion of Immigrants from Scotland and percentage of males with a disability in the United States with a correlation coefficient (R) of 0.450 and weighted average of 11.6%. Similarly, the statistical analysis conducted on geographies consisting of 254,333,979 people shows a poor positive correlation between the proportion of Filipinos and percentage of males with a disability in the United States with a correlation coefficient (R) of 0.100 and weighted average of 9.1%, a difference of 27.2%.
Male Disability Correlation Summary
| Measurement | Immigrants from Scotland | Filipino |
| Minimum | 2.5% | 2.1% |
| Maximum | 44.8% | 19.0% |
| Range | 42.3% | 16.9% |
| Mean | 14.6% | 8.8% |
| Median | 11.7% | 8.4% |
| Interquartile 25% (IQ1) | 10.3% | 7.4% |
| Interquartile 75% (IQ3) | 15.2% | 9.5% |
| Interquartile Range (IQR) | 5.0% | 2.1% |
| Standard Deviation (Sample) | 8.7% | 2.9% |
| Standard Deviation (Population) | 8.6% | 2.9% |
Similar Demographics by Male Disability
Demographics Similar to Immigrants from Scotland by Male Disability
In terms of male disability, the demographic groups most similar to Immigrants from Scotland are Immigrants from Thailand (11.6%, a difference of 0.030%), Mexican American Indian (11.6%, a difference of 0.080%), Ute (11.6%, a difference of 0.20%), Spanish American Indian (11.6%, a difference of 0.30%), and Icelander (11.6%, a difference of 0.31%).
| Demographics | Rating | Rank | Male Disability |
| Serbians | 10.7 /100 | #205 | Poor 11.5% |
| Ukrainians | 10.6 /100 | #206 | Poor 11.5% |
| Immigrants | Somalia | 10.4 /100 | #207 | Poor 11.5% |
| Icelanders | 10.1 /100 | #208 | Poor 11.6% |
| Spanish American Indians | 10.1 /100 | #209 | Poor 11.6% |
| Ute | 9.4 /100 | #210 | Tragic 11.6% |
| Immigrants | Thailand | 8.4 /100 | #211 | Tragic 11.6% |
| Immigrants | Scotland | 8.2 /100 | #212 | Tragic 11.6% |
| Mexican American Indians | 7.8 /100 | #213 | Tragic 11.6% |
| Lithuanians | 6.6 /100 | #214 | Tragic 11.6% |
| Indonesians | 5.9 /100 | #215 | Tragic 11.6% |
| Immigrants | Dominican Republic | 4.9 /100 | #216 | Tragic 11.7% |
| Immigrants | Dominica | 4.6 /100 | #217 | Tragic 11.7% |
| Immigrants | England | 4.0 /100 | #218 | Tragic 11.7% |
| Panamanians | 3.8 /100 | #219 | Tragic 11.7% |
Demographics Similar to Filipinos by Male Disability
In terms of male disability, the demographic groups most similar to Filipinos are Immigrants from Taiwan (9.1%, a difference of 0.010%), Immigrants from India (9.0%, a difference of 0.90%), Thai (9.2%, a difference of 1.3%), Immigrants from Hong Kong (9.4%, a difference of 3.4%), and Immigrants from South Central Asia (9.4%, a difference of 3.5%).
| Demographics | Rating | Rank | Male Disability |
| Immigrants | India | 100.0 /100 | #1 | Exceptional 9.0% |
| Immigrants | Taiwan | 100.0 /100 | #2 | Exceptional 9.1% |
| Filipinos | 100.0 /100 | #3 | Exceptional 9.1% |
| Thais | 100.0 /100 | #4 | Exceptional 9.2% |
| Immigrants | Hong Kong | 100.0 /100 | #5 | Exceptional 9.4% |
| Immigrants | South Central Asia | 100.0 /100 | #6 | Exceptional 9.4% |
| Immigrants | Bolivia | 100.0 /100 | #7 | Exceptional 9.5% |
| Immigrants | China | 100.0 /100 | #8 | Exceptional 9.5% |
| Immigrants | Singapore | 100.0 /100 | #9 | Exceptional 9.5% |
| Immigrants | Israel | 100.0 /100 | #10 | Exceptional 9.6% |
| Immigrants | Eastern Asia | 100.0 /100 | #11 | Exceptional 9.6% |
| Bolivians | 100.0 /100 | #12 | Exceptional 9.6% |
| Iranians | 100.0 /100 | #13 | Exceptional 9.7% |
| Immigrants | Iran | 100.0 /100 | #14 | Exceptional 9.7% |
| Indians (Asian) | 100.0 /100 | #15 | Exceptional 9.7% |