Immigrants from Panama vs Immigrants from South America Hearing Disability
COMPARE
Immigrants from Panama
Immigrants from South America
Hearing Disability
Hearing Disability Comparison
Immigrants from Panama
Immigrants from South America
2.9%
HEARING DISABILITY
76.9/ 100
METRIC RATING
149th/ 347
METRIC RANK
2.7%
HEARING DISABILITY
99.2/ 100
METRIC RATING
49th/ 347
METRIC RANK
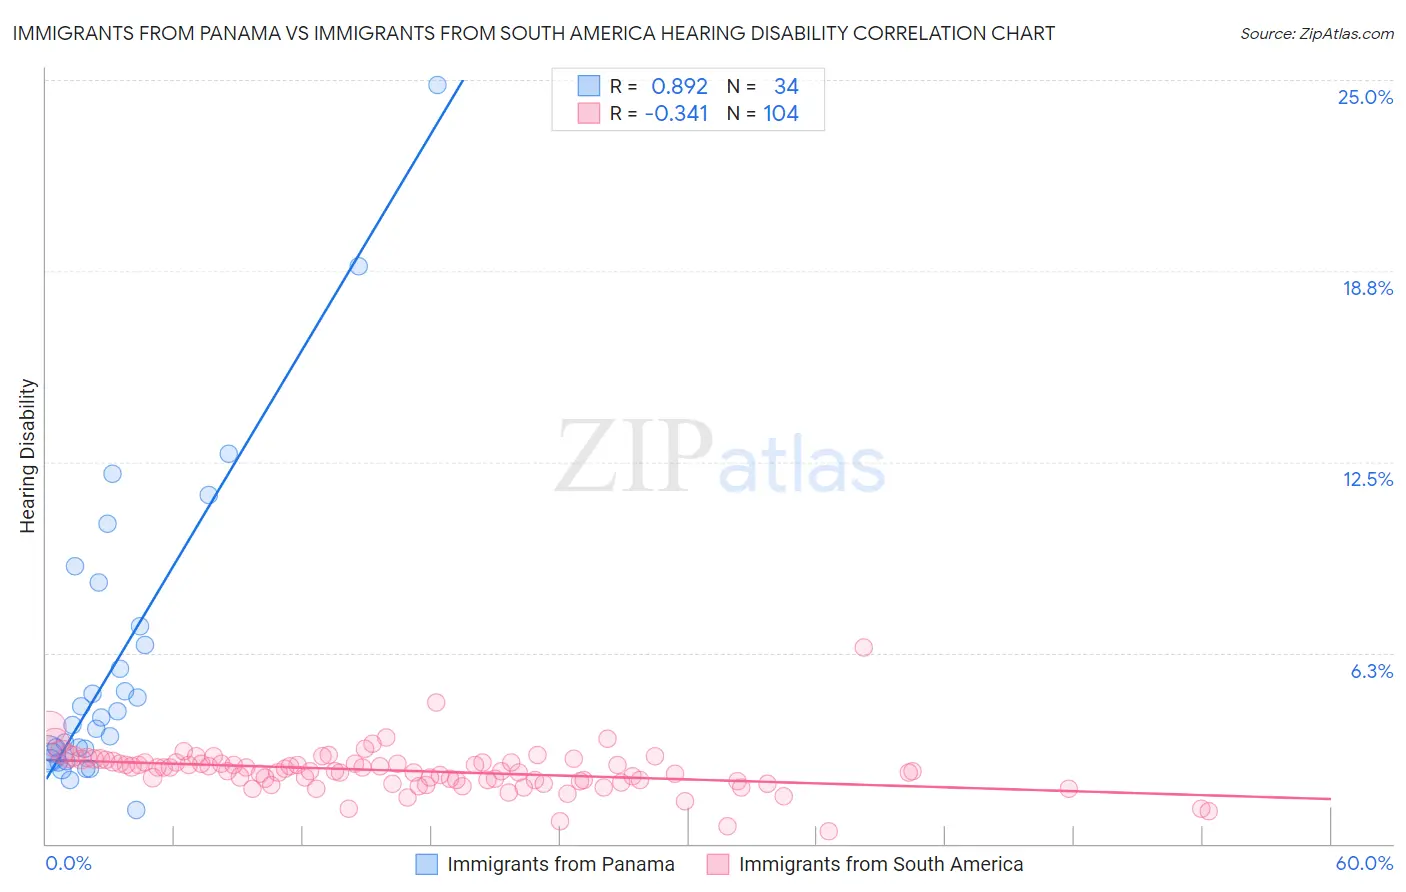
Immigrants from Panama vs Immigrants from South America Hearing Disability Correlation Chart
The statistical analysis conducted on geographies consisting of 221,167,736 people shows a very strong positive correlation between the proportion of Immigrants from Panama and percentage of population with hearing disability in the United States with a correlation coefficient (R) of 0.892 and weighted average of 2.9%. Similarly, the statistical analysis conducted on geographies consisting of 486,101,818 people shows a mild negative correlation between the proportion of Immigrants from South America and percentage of population with hearing disability in the United States with a correlation coefficient (R) of -0.341 and weighted average of 2.7%, a difference of 9.7%.
Hearing Disability Correlation Summary
| Measurement | Immigrants from Panama | Immigrants from South America |
| Minimum | 1.1% | 0.40% |
| Maximum | 24.8% | 6.4% |
| Range | 23.7% | 6.0% |
| Mean | 6.0% | 2.4% |
| Median | 4.0% | 2.4% |
| Interquartile 25% (IQ1) | 3.0% | 2.1% |
| Interquartile 75% (IQ3) | 7.1% | 2.7% |
| Interquartile Range (IQR) | 4.1% | 0.61% |
| Standard Deviation (Sample) | 5.1% | 0.73% |
| Standard Deviation (Population) | 5.0% | 0.73% |
Similar Demographics by Hearing Disability
Demographics Similar to Immigrants from Panama by Hearing Disability
In terms of hearing disability, the demographic groups most similar to Immigrants from Panama are Immigrants from Russia (2.9%, a difference of 0.11%), Tongan (2.9%, a difference of 0.25%), Brazilian (2.9%, a difference of 0.26%), Immigrants from Congo (2.9%, a difference of 0.28%), and Immigrants from Bulgaria (2.9%, a difference of 0.33%).
| Demographics | Rating | Rank | Hearing Disability |
| Laotians | 81.1 /100 | #142 | Excellent 2.9% |
| Immigrants | Bahamas | 80.9 /100 | #143 | Excellent 2.9% |
| Immigrants | Bulgaria | 79.2 /100 | #144 | Good 2.9% |
| Immigrants | Congo | 78.9 /100 | #145 | Good 2.9% |
| Brazilians | 78.7 /100 | #146 | Good 2.9% |
| Tongans | 78.6 /100 | #147 | Good 2.9% |
| Immigrants | Russia | 77.7 /100 | #148 | Good 2.9% |
| Immigrants | Panama | 76.9 /100 | #149 | Good 2.9% |
| Palestinians | 73.6 /100 | #150 | Good 2.9% |
| Immigrants | France | 73.1 /100 | #151 | Good 2.9% |
| Immigrants | Lithuania | 73.0 /100 | #152 | Good 2.9% |
| Sudanese | 72.1 /100 | #153 | Good 2.9% |
| Immigrants | Lebanon | 71.5 /100 | #154 | Good 2.9% |
| Costa Ricans | 71.4 /100 | #155 | Good 2.9% |
| Immigrants | Poland | 70.2 /100 | #156 | Good 2.9% |
Demographics Similar to Immigrants from South America by Hearing Disability
In terms of hearing disability, the demographic groups most similar to Immigrants from South America are Immigrants from Singapore (2.6%, a difference of 0.12%), Immigrants from Israel (2.6%, a difference of 0.19%), Paraguayan (2.7%, a difference of 0.19%), Immigrants from Hong Kong (2.7%, a difference of 0.26%), and Immigrants from Dominica (2.6%, a difference of 0.34%).
| Demographics | Rating | Rank | Hearing Disability |
| West Indians | 99.4 /100 | #42 | Exceptional 2.6% |
| Senegalese | 99.4 /100 | #43 | Exceptional 2.6% |
| Nigerians | 99.4 /100 | #44 | Exceptional 2.6% |
| Venezuelans | 99.4 /100 | #45 | Exceptional 2.6% |
| Immigrants | Dominica | 99.3 /100 | #46 | Exceptional 2.6% |
| Immigrants | Israel | 99.3 /100 | #47 | Exceptional 2.6% |
| Immigrants | Singapore | 99.3 /100 | #48 | Exceptional 2.6% |
| Immigrants | South America | 99.2 /100 | #49 | Exceptional 2.7% |
| Paraguayans | 99.2 /100 | #50 | Exceptional 2.7% |
| Immigrants | Hong Kong | 99.2 /100 | #51 | Exceptional 2.7% |
| Jamaicans | 99.0 /100 | #52 | Exceptional 2.7% |
| Immigrants | Eastern Asia | 99.0 /100 | #53 | Exceptional 2.7% |
| Ethiopians | 99.0 /100 | #54 | Exceptional 2.7% |
| Immigrants | Ethiopia | 99.0 /100 | #55 | Exceptional 2.7% |
| Immigrants | Nicaragua | 99.0 /100 | #56 | Exceptional 2.7% |