Immigrants from Pakistan vs Swedish Disability Age Under 5
COMPARE
Immigrants from Pakistan
Swedish
Disability Age Under 5
Disability Age Under 5 Comparison
Immigrants from Pakistan
Swedes
1.1%
DISABILITY AGE UNDER 5
98.4/ 100
METRIC RATING
75th/ 347
METRIC RANK
1.6%
DISABILITY AGE UNDER 5
0.0/ 100
METRIC RATING
294th/ 347
METRIC RANK
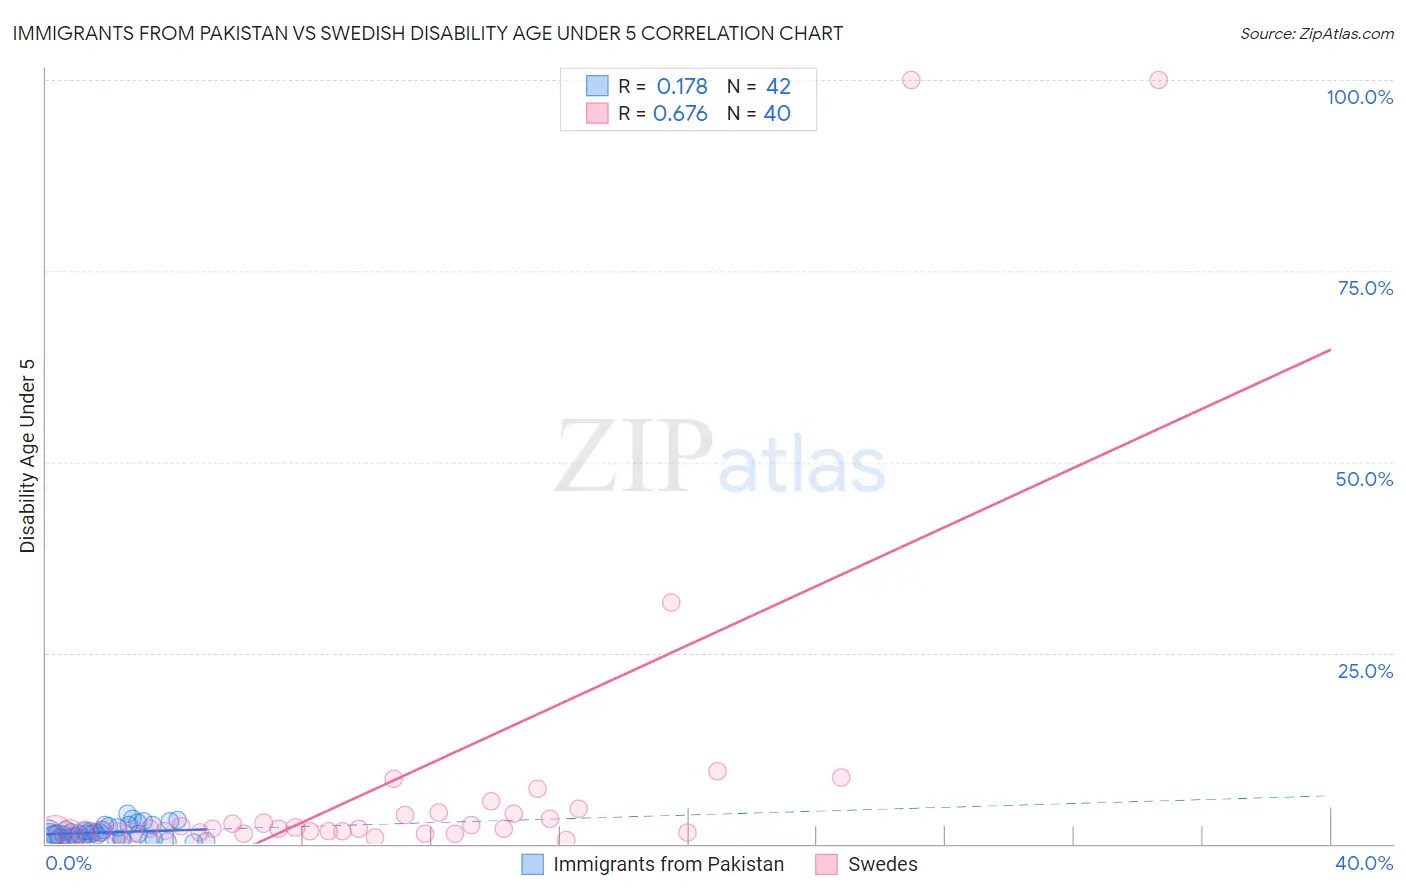
Immigrants from Pakistan vs Swedish Disability Age Under 5 Correlation Chart
The statistical analysis conducted on geographies consisting of 169,764,287 people shows a poor positive correlation between the proportion of Immigrants from Pakistan and percentage of population with a disability under the age of 5 in the United States with a correlation coefficient (R) of 0.178 and weighted average of 1.1%. Similarly, the statistical analysis conducted on geographies consisting of 252,407,274 people shows a significant positive correlation between the proportion of Swedes and percentage of population with a disability under the age of 5 in the United States with a correlation coefficient (R) of 0.676 and weighted average of 1.6%, a difference of 40.5%.
Disability Age Under 5 Correlation Summary
| Measurement | Immigrants from Pakistan | Swedish |
| Minimum | 0.17% | 0.49% |
| Maximum | 3.9% | 100.0% |
| Range | 3.7% | 99.5% |
| Mean | 1.5% | 8.4% |
| Median | 1.3% | 2.0% |
| Interquartile 25% (IQ1) | 0.82% | 1.5% |
| Interquartile 75% (IQ3) | 2.2% | 4.0% |
| Interquartile Range (IQR) | 1.4% | 2.5% |
| Standard Deviation (Sample) | 0.91% | 21.9% |
| Standard Deviation (Population) | 0.90% | 21.6% |
Similar Demographics by Disability Age Under 5
Demographics Similar to Immigrants from Pakistan by Disability Age Under 5
In terms of disability age under 5, the demographic groups most similar to Immigrants from Pakistan are Immigrants from Sri Lanka (1.1%, a difference of 0.090%), Jordanian (1.1%, a difference of 0.090%), Burmese (1.1%, a difference of 0.17%), Immigrants from Burma/Myanmar (1.1%, a difference of 0.26%), and Trinidadian and Tobagonian (1.1%, a difference of 0.33%).
| Demographics | Rating | Rank | Disability Age Under 5 |
| South Africans | 98.7 /100 | #68 | Exceptional 1.1% |
| Israelis | 98.7 /100 | #69 | Exceptional 1.1% |
| Immigrants | Ecuador | 98.6 /100 | #70 | Exceptional 1.1% |
| Trinidadians and Tobagonians | 98.6 /100 | #71 | Exceptional 1.1% |
| Burmese | 98.5 /100 | #72 | Exceptional 1.1% |
| Immigrants | Sri Lanka | 98.5 /100 | #73 | Exceptional 1.1% |
| Jordanians | 98.5 /100 | #74 | Exceptional 1.1% |
| Immigrants | Pakistan | 98.4 /100 | #75 | Exceptional 1.1% |
| Immigrants | Burma/Myanmar | 98.2 /100 | #76 | Exceptional 1.1% |
| Immigrants | Denmark | 98.1 /100 | #77 | Exceptional 1.1% |
| West Indians | 98.0 /100 | #78 | Exceptional 1.1% |
| Hmong | 98.0 /100 | #79 | Exceptional 1.1% |
| Immigrants | Trinidad and Tobago | 98.0 /100 | #80 | Exceptional 1.1% |
| Turks | 98.0 /100 | #81 | Exceptional 1.1% |
| Immigrants | Jordan | 97.9 /100 | #82 | Exceptional 1.1% |
Demographics Similar to Swedes by Disability Age Under 5
In terms of disability age under 5, the demographic groups most similar to Swedes are Finnish (1.6%, a difference of 0.62%), Polish (1.6%, a difference of 0.71%), Lithuanian (1.6%, a difference of 1.2%), Italian (1.6%, a difference of 1.7%), and Nonimmigrants (1.6%, a difference of 1.7%).
| Demographics | Rating | Rank | Disability Age Under 5 |
| Scandinavians | 0.0 /100 | #287 | Tragic 1.5% |
| Estonians | 0.0 /100 | #288 | Tragic 1.5% |
| Hungarians | 0.0 /100 | #289 | Tragic 1.5% |
| Czechs | 0.0 /100 | #290 | Tragic 1.5% |
| Northern Europeans | 0.0 /100 | #291 | Tragic 1.6% |
| Italians | 0.0 /100 | #292 | Tragic 1.6% |
| Lithuanians | 0.0 /100 | #293 | Tragic 1.6% |
| Swedes | 0.0 /100 | #294 | Tragic 1.6% |
| Finns | 0.0 /100 | #295 | Tragic 1.6% |
| Poles | 0.0 /100 | #296 | Tragic 1.6% |
| Immigrants | Nonimmigrants | 0.0 /100 | #297 | Tragic 1.6% |
| Cajuns | 0.0 /100 | #298 | Tragic 1.6% |
| Portuguese | 0.0 /100 | #299 | Tragic 1.6% |
| Shoshone | 0.0 /100 | #300 | Tragic 1.6% |
| German Russians | 0.0 /100 | #301 | Tragic 1.6% |