Immigrants from Pakistan vs Immigrants from Cuba Disability Age Under 5
COMPARE
Immigrants from Pakistan
Immigrants from Cuba
Disability Age Under 5
Disability Age Under 5 Comparison
Immigrants from Pakistan
Immigrants from Cuba
1.1%
DISABILITY AGE UNDER 5
98.4/ 100
METRIC RATING
75th/ 347
METRIC RANK
1.1%
DISABILITY AGE UNDER 5
97.0/ 100
METRIC RATING
92nd/ 347
METRIC RANK
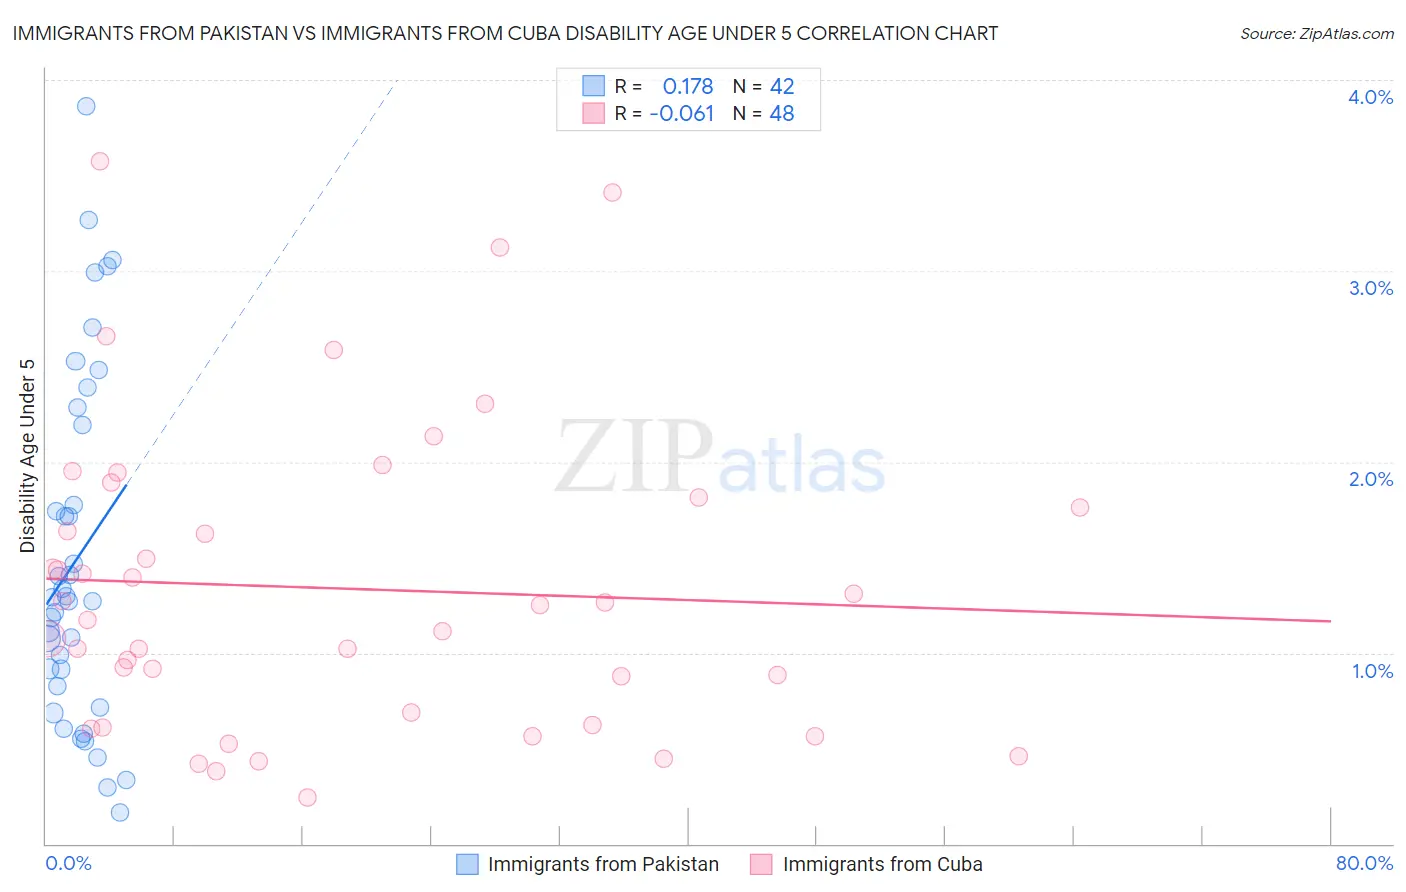
Immigrants from Pakistan vs Immigrants from Cuba Disability Age Under 5 Correlation Chart
The statistical analysis conducted on geographies consisting of 169,764,287 people shows a poor positive correlation between the proportion of Immigrants from Pakistan and percentage of population with a disability under the age of 5 in the United States with a correlation coefficient (R) of 0.178 and weighted average of 1.1%. Similarly, the statistical analysis conducted on geographies consisting of 186,893,063 people shows a slight negative correlation between the proportion of Immigrants from Cuba and percentage of population with a disability under the age of 5 in the United States with a correlation coefficient (R) of -0.061 and weighted average of 1.1%, a difference of 1.6%.
Disability Age Under 5 Correlation Summary
| Measurement | Immigrants from Pakistan | Immigrants from Cuba |
| Minimum | 0.17% | 0.24% |
| Maximum | 3.9% | 3.6% |
| Range | 3.7% | 3.3% |
| Mean | 1.5% | 1.3% |
| Median | 1.3% | 1.2% |
| Interquartile 25% (IQ1) | 0.82% | 0.66% |
| Interquartile 75% (IQ3) | 2.2% | 1.8% |
| Interquartile Range (IQR) | 1.4% | 1.1% |
| Standard Deviation (Sample) | 0.91% | 0.80% |
| Standard Deviation (Population) | 0.90% | 0.79% |
Demographics Similar to Immigrants from Pakistan and Immigrants from Cuba by Disability Age Under 5
In terms of disability age under 5, the demographic groups most similar to Immigrants from Pakistan are Immigrants from Sri Lanka (1.1%, a difference of 0.090%), Jordanian (1.1%, a difference of 0.090%), Immigrants from Burma/Myanmar (1.1%, a difference of 0.26%), Immigrants from Denmark (1.1%, a difference of 0.41%), and West Indian (1.1%, a difference of 0.53%). Similarly, the demographic groups most similar to Immigrants from Cuba are Spanish American (1.1%, a difference of 0.030%), Albanian (1.1%, a difference of 0.17%), Chinese (1.1%, a difference of 0.21%), Ethiopian (1.1%, a difference of 0.24%), and Immigrants from Dominican Republic (1.1%, a difference of 0.53%).
| Demographics | Rating | Rank | Disability Age Under 5 |
| Immigrants | Sri Lanka | 98.5 /100 | #73 | Exceptional 1.1% |
| Jordanians | 98.5 /100 | #74 | Exceptional 1.1% |
| Immigrants | Pakistan | 98.4 /100 | #75 | Exceptional 1.1% |
| Immigrants | Burma/Myanmar | 98.2 /100 | #76 | Exceptional 1.1% |
| Immigrants | Denmark | 98.1 /100 | #77 | Exceptional 1.1% |
| West Indians | 98.0 /100 | #78 | Exceptional 1.1% |
| Hmong | 98.0 /100 | #79 | Exceptional 1.1% |
| Immigrants | Trinidad and Tobago | 98.0 /100 | #80 | Exceptional 1.1% |
| Turks | 98.0 /100 | #81 | Exceptional 1.1% |
| Immigrants | Jordan | 97.9 /100 | #82 | Exceptional 1.1% |
| Immigrants | Syria | 97.9 /100 | #83 | Exceptional 1.1% |
| Immigrants | Zaire | 97.8 /100 | #84 | Exceptional 1.1% |
| Sudanese | 97.7 /100 | #85 | Exceptional 1.1% |
| Okinawans | 97.6 /100 | #86 | Exceptional 1.1% |
| Ugandans | 97.5 /100 | #87 | Exceptional 1.1% |
| Immigrants | Dominican Republic | 97.5 /100 | #88 | Exceptional 1.1% |
| Ethiopians | 97.2 /100 | #89 | Exceptional 1.1% |
| Chinese | 97.2 /100 | #90 | Exceptional 1.1% |
| Albanians | 97.2 /100 | #91 | Exceptional 1.1% |
| Immigrants | Cuba | 97.0 /100 | #92 | Exceptional 1.1% |
| Spanish Americans | 96.9 /100 | #93 | Exceptional 1.1% |