Immigrants from Pakistan vs Swedish 12th Grade, No Diploma
COMPARE
Immigrants from Pakistan
Swedish
12th Grade, No Diploma
12th Grade, No Diploma Comparison
Immigrants from Pakistan
Swedes
91.4%
12TH GRADE, NO DIPLOMA
70.7/ 100
METRIC RATING
157th/ 347
METRIC RANK
93.7%
12TH GRADE, NO DIPLOMA
100.0/ 100
METRIC RATING
2nd/ 347
METRIC RANK
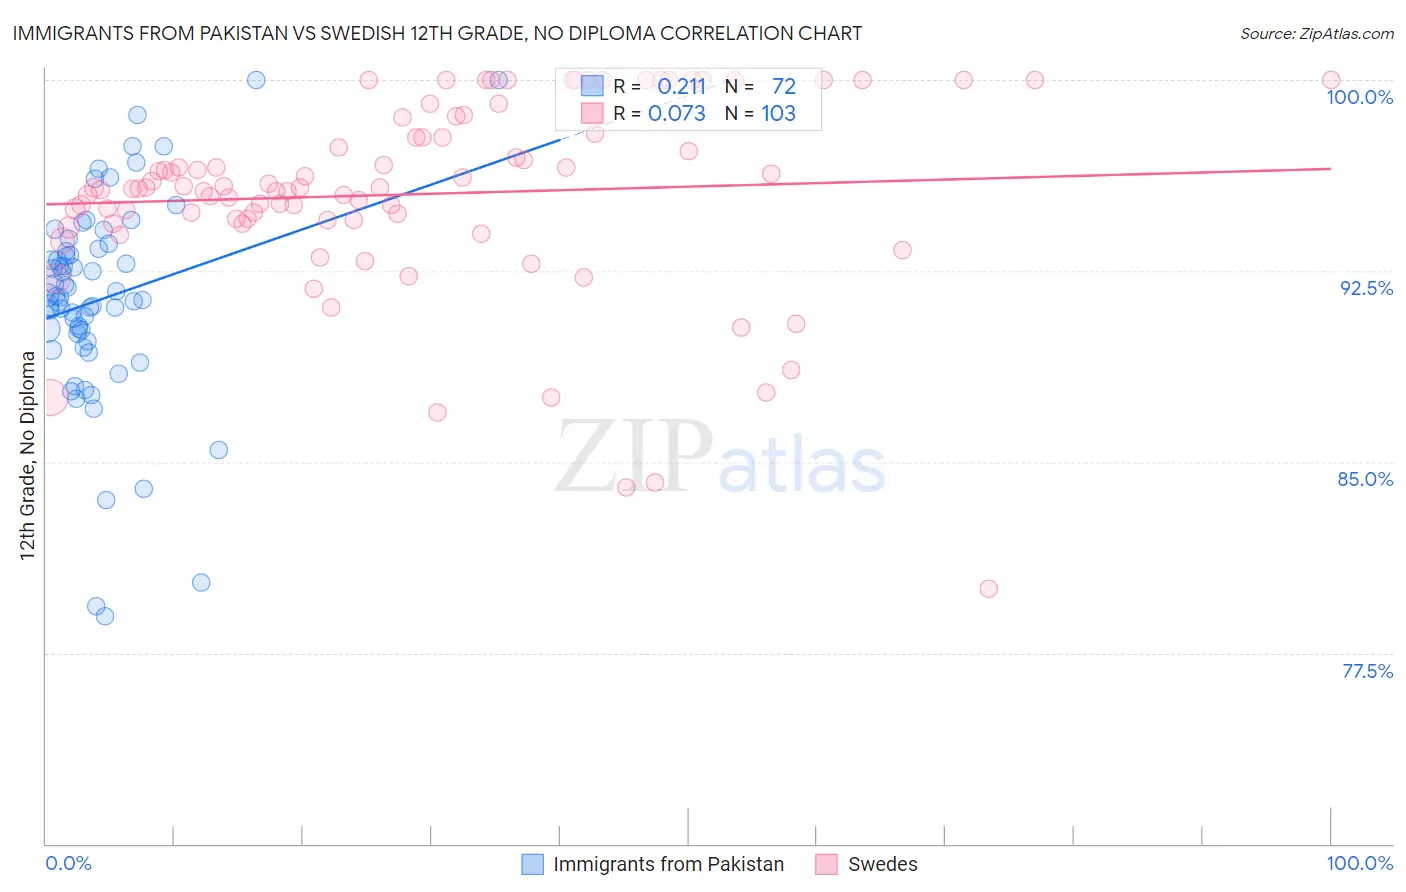
Immigrants from Pakistan vs Swedish 12th Grade, No Diploma Correlation Chart
The statistical analysis conducted on geographies consisting of 283,836,244 people shows a weak positive correlation between the proportion of Immigrants from Pakistan and percentage of population with at least 12th grade (no diploma) education in the United States with a correlation coefficient (R) of 0.211 and weighted average of 91.4%. Similarly, the statistical analysis conducted on geographies consisting of 539,231,694 people shows a slight positive correlation between the proportion of Swedes and percentage of population with at least 12th grade (no diploma) education in the United States with a correlation coefficient (R) of 0.073 and weighted average of 93.7%, a difference of 2.5%.
12th Grade, No Diploma Correlation Summary
| Measurement | Immigrants from Pakistan | Swedish |
| Minimum | 78.9% | 80.0% |
| Maximum | 100.0% | 100.0% |
| Range | 21.1% | 20.0% |
| Mean | 91.4% | 95.5% |
| Median | 91.5% | 95.8% |
| Interquartile 25% (IQ1) | 89.9% | 94.5% |
| Interquartile 75% (IQ3) | 93.3% | 97.9% |
| Interquartile Range (IQR) | 3.5% | 3.4% |
| Standard Deviation (Sample) | 4.1% | 3.8% |
| Standard Deviation (Population) | 4.0% | 3.8% |
Similar Demographics by 12th Grade, No Diploma
Demographics Similar to Immigrants from Pakistan by 12th Grade, No Diploma
In terms of 12th grade, no diploma, the demographic groups most similar to Immigrants from Pakistan are Asian (91.4%, a difference of 0.020%), Immigrants from Iraq (91.4%, a difference of 0.040%), Immigrants from Kenya (91.5%, a difference of 0.050%), Immigrants from Northern Africa (91.4%, a difference of 0.060%), and Iraqi (91.5%, a difference of 0.070%).
| Demographics | Rating | Rank | 12th Grade, No Diploma |
| Paraguayans | 78.9 /100 | #150 | Good 91.5% |
| Chippewa | 78.8 /100 | #151 | Good 91.5% |
| Kenyans | 77.4 /100 | #152 | Good 91.5% |
| Iraqis | 75.3 /100 | #153 | Good 91.5% |
| Immigrants | Kenya | 73.9 /100 | #154 | Good 91.5% |
| Immigrants | Iraq | 73.0 /100 | #155 | Good 91.4% |
| Asians | 71.9 /100 | #156 | Good 91.4% |
| Immigrants | Pakistan | 70.7 /100 | #157 | Good 91.4% |
| Immigrants | Northern Africa | 66.2 /100 | #158 | Good 91.4% |
| Laotians | 64.4 /100 | #159 | Good 91.3% |
| Immigrants | Albania | 64.1 /100 | #160 | Good 91.3% |
| Immigrants | Hong Kong | 63.8 /100 | #161 | Good 91.3% |
| Brazilians | 62.0 /100 | #162 | Good 91.3% |
| Immigrants | Asia | 61.5 /100 | #163 | Good 91.3% |
| Immigrants | China | 60.9 /100 | #164 | Good 91.3% |
Demographics Similar to Swedes by 12th Grade, No Diploma
In terms of 12th grade, no diploma, the demographic groups most similar to Swedes are Lithuanian (93.6%, a difference of 0.10%), Slovene (93.6%, a difference of 0.11%), Carpatho Rusyn (93.6%, a difference of 0.12%), Immigrants from India (93.6%, a difference of 0.13%), and Slovak (93.6%, a difference of 0.17%).
| Demographics | Rating | Rank | 12th Grade, No Diploma |
| Norwegians | 100.0 /100 | #1 | Exceptional 94.0% |
| Swedes | 100.0 /100 | #2 | Exceptional 93.7% |
| Lithuanians | 100.0 /100 | #3 | Exceptional 93.6% |
| Slovenes | 100.0 /100 | #4 | Exceptional 93.6% |
| Carpatho Rusyns | 100.0 /100 | #5 | Exceptional 93.6% |
| Immigrants | India | 100.0 /100 | #6 | Exceptional 93.6% |
| Slovaks | 100.0 /100 | #7 | Exceptional 93.6% |
| Chinese | 100.0 /100 | #8 | Exceptional 93.6% |
| Latvians | 100.0 /100 | #9 | Exceptional 93.6% |
| Croatians | 100.0 /100 | #10 | Exceptional 93.5% |
| Poles | 100.0 /100 | #11 | Exceptional 93.5% |
| Eastern Europeans | 100.0 /100 | #12 | Exceptional 93.5% |
| Danes | 100.0 /100 | #13 | Exceptional 93.5% |
| Bulgarians | 100.0 /100 | #14 | Exceptional 93.5% |
| Finns | 100.0 /100 | #15 | Exceptional 93.4% |