Immigrants from Pakistan vs Mexican American Indian Disability
COMPARE
Immigrants from Pakistan
Mexican American Indian
Disability
Disability Comparison
Immigrants from Pakistan
Mexican American Indians
10.4%
DISABILITY
100.0/ 100
METRIC RATING
19th/ 347
METRIC RANK
12.0%
DISABILITY
11.4/ 100
METRIC RATING
204th/ 347
METRIC RANK
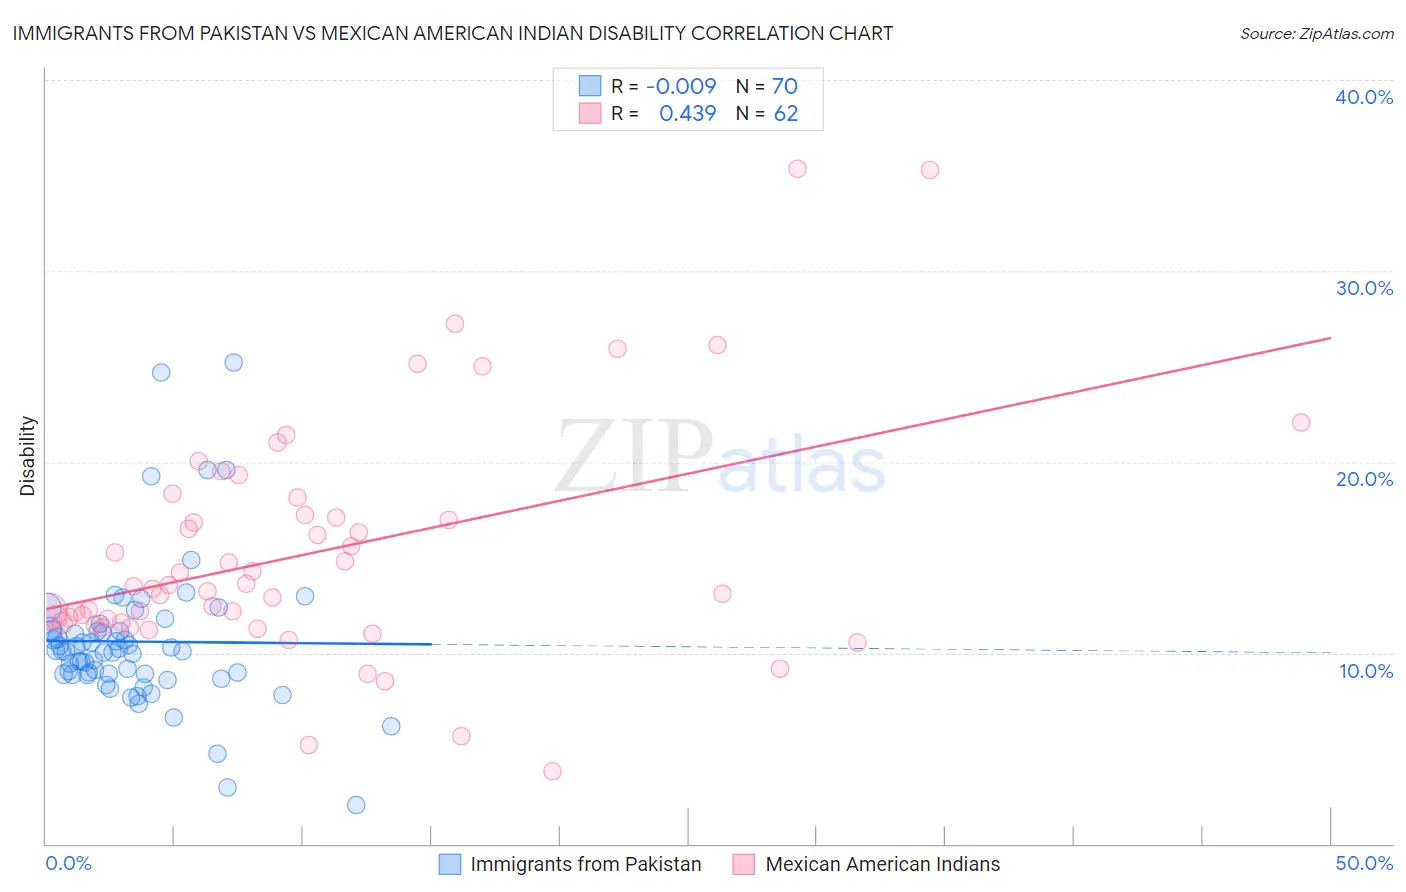
Immigrants from Pakistan vs Mexican American Indian Disability Correlation Chart
The statistical analysis conducted on geographies consisting of 283,903,019 people shows no correlation between the proportion of Immigrants from Pakistan and percentage of population with a disability in the United States with a correlation coefficient (R) of -0.009 and weighted average of 10.4%. Similarly, the statistical analysis conducted on geographies consisting of 317,572,347 people shows a moderate positive correlation between the proportion of Mexican American Indians and percentage of population with a disability in the United States with a correlation coefficient (R) of 0.439 and weighted average of 12.0%, a difference of 15.4%.
Disability Correlation Summary
| Measurement | Immigrants from Pakistan | Mexican American Indian |
| Minimum | 2.0% | 3.8% |
| Maximum | 25.2% | 35.4% |
| Range | 23.2% | 31.6% |
| Mean | 10.6% | 15.3% |
| Median | 10.1% | 13.4% |
| Interquartile 25% (IQ1) | 8.9% | 11.6% |
| Interquartile 75% (IQ3) | 11.2% | 17.2% |
| Interquartile Range (IQR) | 2.3% | 5.6% |
| Standard Deviation (Sample) | 3.8% | 6.2% |
| Standard Deviation (Population) | 3.8% | 6.1% |
Similar Demographics by Disability
Demographics Similar to Immigrants from Pakistan by Disability
In terms of disability, the demographic groups most similar to Immigrants from Pakistan are Burmese (10.4%, a difference of 0.010%), Immigrants from Venezuela (10.4%, a difference of 0.69%), Asian (10.4%, a difference of 0.72%), Immigrants from Sri Lanka (10.5%, a difference of 0.82%), and Immigrants from Iran (10.3%, a difference of 0.99%).
| Demographics | Rating | Rank | Disability |
| Immigrants | Israel | 100.0 /100 | #12 | Exceptional 10.1% |
| Immigrants | Eastern Asia | 100.0 /100 | #13 | Exceptional 10.2% |
| Immigrants | Korea | 100.0 /100 | #14 | Exceptional 10.2% |
| Okinawans | 100.0 /100 | #15 | Exceptional 10.3% |
| Indians (Asian) | 100.0 /100 | #16 | Exceptional 10.3% |
| Immigrants | Iran | 100.0 /100 | #17 | Exceptional 10.3% |
| Burmese | 100.0 /100 | #18 | Exceptional 10.4% |
| Immigrants | Pakistan | 100.0 /100 | #19 | Exceptional 10.4% |
| Immigrants | Venezuela | 100.0 /100 | #20 | Exceptional 10.4% |
| Asians | 100.0 /100 | #21 | Exceptional 10.4% |
| Immigrants | Sri Lanka | 100.0 /100 | #22 | Exceptional 10.5% |
| Immigrants | Asia | 100.0 /100 | #23 | Exceptional 10.5% |
| Venezuelans | 100.0 /100 | #24 | Exceptional 10.5% |
| Immigrants | Malaysia | 100.0 /100 | #25 | Exceptional 10.6% |
| Argentineans | 100.0 /100 | #26 | Exceptional 10.6% |
Demographics Similar to Mexican American Indians by Disability
In terms of disability, the demographic groups most similar to Mexican American Indians are British West Indian (12.0%, a difference of 0.0%), Immigrants from England (12.0%, a difference of 0.050%), Assyrian/Chaldean/Syriac (11.9%, a difference of 0.12%), Belizean (11.9%, a difference of 0.14%), and Immigrants from Western Europe (12.0%, a difference of 0.16%).
| Demographics | Rating | Rank | Disability |
| Immigrants | Belize | 15.2 /100 | #197 | Poor 11.9% |
| Ukrainians | 14.7 /100 | #198 | Poor 11.9% |
| Immigrants | Panama | 14.6 /100 | #199 | Poor 11.9% |
| Belizeans | 12.8 /100 | #200 | Poor 11.9% |
| Assyrians/Chaldeans/Syriacs | 12.6 /100 | #201 | Poor 11.9% |
| Immigrants | England | 12.0 /100 | #202 | Poor 12.0% |
| British West Indians | 11.5 /100 | #203 | Poor 12.0% |
| Mexican American Indians | 11.4 /100 | #204 | Poor 12.0% |
| Immigrants | Western Europe | 10.1 /100 | #205 | Poor 12.0% |
| Immigrants | Senegal | 9.4 /100 | #206 | Tragic 12.0% |
| Immigrants | Thailand | 9.3 /100 | #207 | Tragic 12.0% |
| Immigrants | Caribbean | 9.1 /100 | #208 | Tragic 12.0% |
| Danes | 8.7 /100 | #209 | Tragic 12.0% |
| Czechs | 7.9 /100 | #210 | Tragic 12.0% |
| Immigrants | Cambodia | 7.3 /100 | #211 | Tragic 12.0% |