Immigrants from Pakistan vs Polish Median Household Income
COMPARE
Immigrants from Pakistan
Polish
Median Household Income
Median Household Income Comparison
Immigrants from Pakistan
Poles
$97,528
MEDIAN HOUSEHOLD INCOME
100.0/ 100
METRIC RATING
36th/ 347
METRIC RANK
$88,472
MEDIAN HOUSEHOLD INCOME
89.7/ 100
METRIC RATING
136th/ 347
METRIC RANK
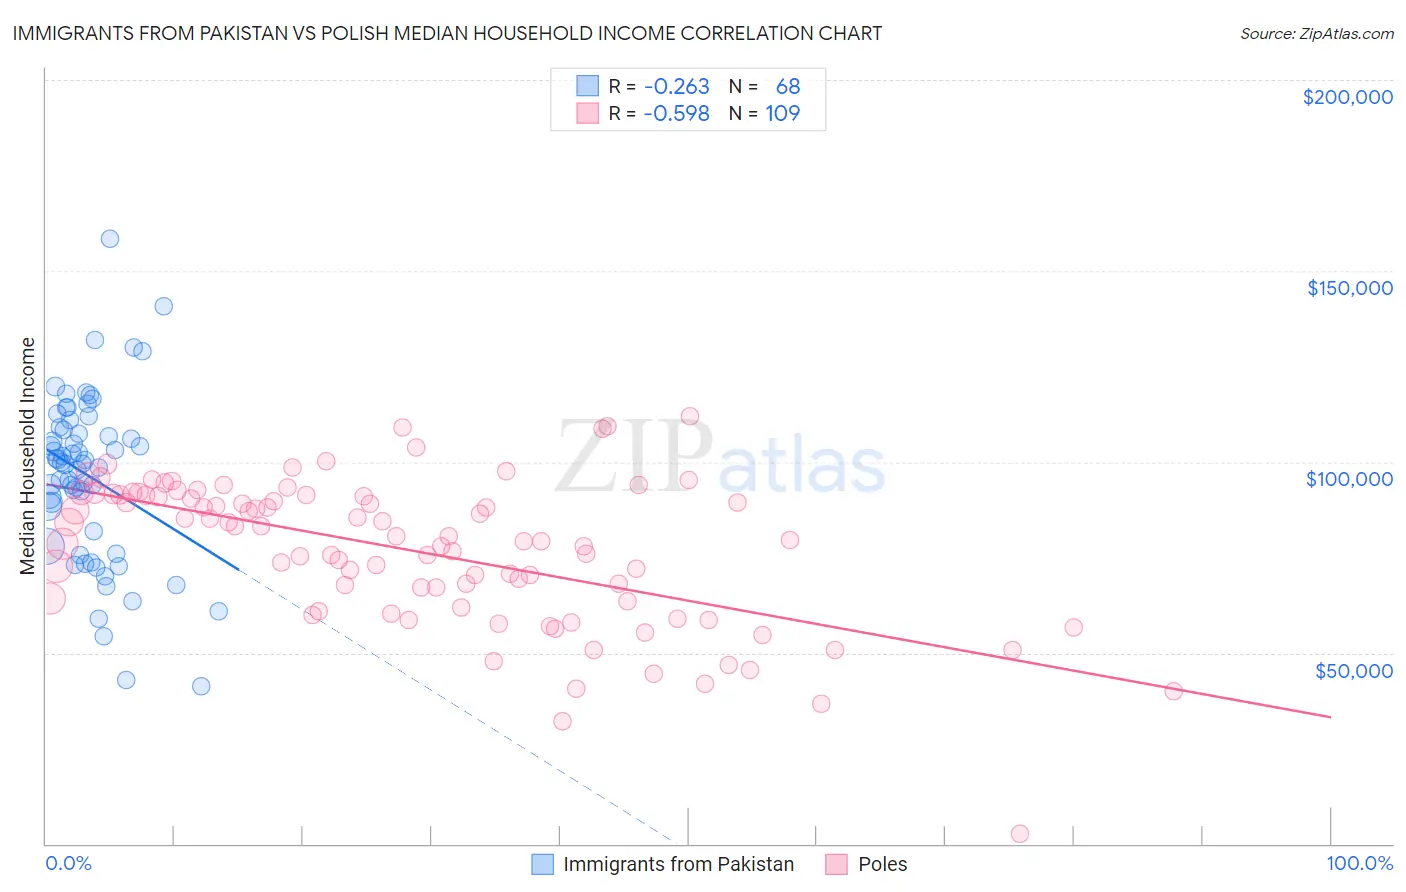
Immigrants from Pakistan vs Polish Median Household Income Correlation Chart
The statistical analysis conducted on geographies consisting of 283,734,459 people shows a weak negative correlation between the proportion of Immigrants from Pakistan and median household income in the United States with a correlation coefficient (R) of -0.263 and weighted average of $97,528. Similarly, the statistical analysis conducted on geographies consisting of 559,571,407 people shows a substantial negative correlation between the proportion of Poles and median household income in the United States with a correlation coefficient (R) of -0.598 and weighted average of $88,472, a difference of 10.2%.
Median Household Income Correlation Summary
| Measurement | Immigrants from Pakistan | Polish |
| Minimum | $41,375 | $2,499 |
| Maximum | $158,426 | $112,083 |
| Range | $117,051 | $109,584 |
| Mean | $96,211 | $76,577 |
| Median | $99,663 | $79,444 |
| Interquartile 25% (IQ1) | $79,936 | $62,696 |
| Interquartile 75% (IQ3) | $108,805 | $91,347 |
| Interquartile Range (IQR) | $28,869 | $28,651 |
| Standard Deviation (Sample) | $22,052 | $19,210 |
| Standard Deviation (Population) | $21,889 | $19,121 |
Similar Demographics by Median Household Income
Demographics Similar to Immigrants from Pakistan by Median Household Income
In terms of median household income, the demographic groups most similar to Immigrants from Pakistan are Latvian ($97,311, a difference of 0.22%), Immigrants from Indonesia ($97,297, a difference of 0.24%), Immigrants from Switzerland ($97,979, a difference of 0.46%), Russian ($98,008, a difference of 0.49%), and Afghan ($97,026, a difference of 0.52%).
| Demographics | Rating | Rank | Median Household Income |
| Immigrants | Asia | 100.0 /100 | #29 | Exceptional $99,933 |
| Immigrants | Northern Europe | 100.0 /100 | #30 | Exceptional $99,813 |
| Turks | 100.0 /100 | #31 | Exceptional $99,389 |
| Immigrants | Denmark | 100.0 /100 | #32 | Exceptional $98,510 |
| Chinese | 100.0 /100 | #33 | Exceptional $98,496 |
| Russians | 100.0 /100 | #34 | Exceptional $98,008 |
| Immigrants | Switzerland | 100.0 /100 | #35 | Exceptional $97,979 |
| Immigrants | Pakistan | 100.0 /100 | #36 | Exceptional $97,528 |
| Latvians | 100.0 /100 | #37 | Exceptional $97,311 |
| Immigrants | Indonesia | 100.0 /100 | #38 | Exceptional $97,297 |
| Afghans | 100.0 /100 | #39 | Exceptional $97,026 |
| Maltese | 100.0 /100 | #40 | Exceptional $97,015 |
| Immigrants | Turkey | 100.0 /100 | #41 | Exceptional $96,964 |
| Immigrants | Lithuania | 99.9 /100 | #42 | Exceptional $96,836 |
| Immigrants | France | 99.9 /100 | #43 | Exceptional $96,743 |
Demographics Similar to Poles by Median Household Income
In terms of median household income, the demographic groups most similar to Poles are Sierra Leonean ($88,463, a difference of 0.010%), Immigrants from Sierra Leone ($88,498, a difference of 0.030%), Swedish ($88,524, a difference of 0.060%), Arab ($88,398, a difference of 0.080%), and Immigrants from Chile ($88,388, a difference of 0.090%).
| Demographics | Rating | Rank | Median Household Income |
| Brazilians | 92.1 /100 | #129 | Exceptional $88,934 |
| British | 92.0 /100 | #130 | Exceptional $88,914 |
| Immigrants | Syria | 91.4 /100 | #131 | Exceptional $88,792 |
| Europeans | 91.2 /100 | #132 | Exceptional $88,751 |
| Immigrants | Ethiopia | 90.9 /100 | #133 | Exceptional $88,687 |
| Swedes | 90.0 /100 | #134 | Exceptional $88,524 |
| Immigrants | Sierra Leone | 89.9 /100 | #135 | Excellent $88,498 |
| Poles | 89.7 /100 | #136 | Excellent $88,472 |
| Sierra Leoneans | 89.6 /100 | #137 | Excellent $88,463 |
| Arabs | 89.2 /100 | #138 | Excellent $88,398 |
| Immigrants | Chile | 89.2 /100 | #139 | Excellent $88,388 |
| Lebanese | 87.2 /100 | #140 | Excellent $88,091 |
| Immigrants | Morocco | 86.0 /100 | #141 | Excellent $87,930 |
| Canadians | 84.7 /100 | #142 | Excellent $87,769 |
| Danes | 83.9 /100 | #143 | Excellent $87,676 |