Immigrants from Pakistan vs Samoan Ambulatory Disability
COMPARE
Immigrants from Pakistan
Samoan
Ambulatory Disability
Ambulatory Disability Comparison
Immigrants from Pakistan
Samoans
5.5%
AMBULATORY DISABILITY
100.0/ 100
METRIC RATING
33rd/ 347
METRIC RANK
6.3%
AMBULATORY DISABILITY
12.1/ 100
METRIC RATING
211th/ 347
METRIC RANK
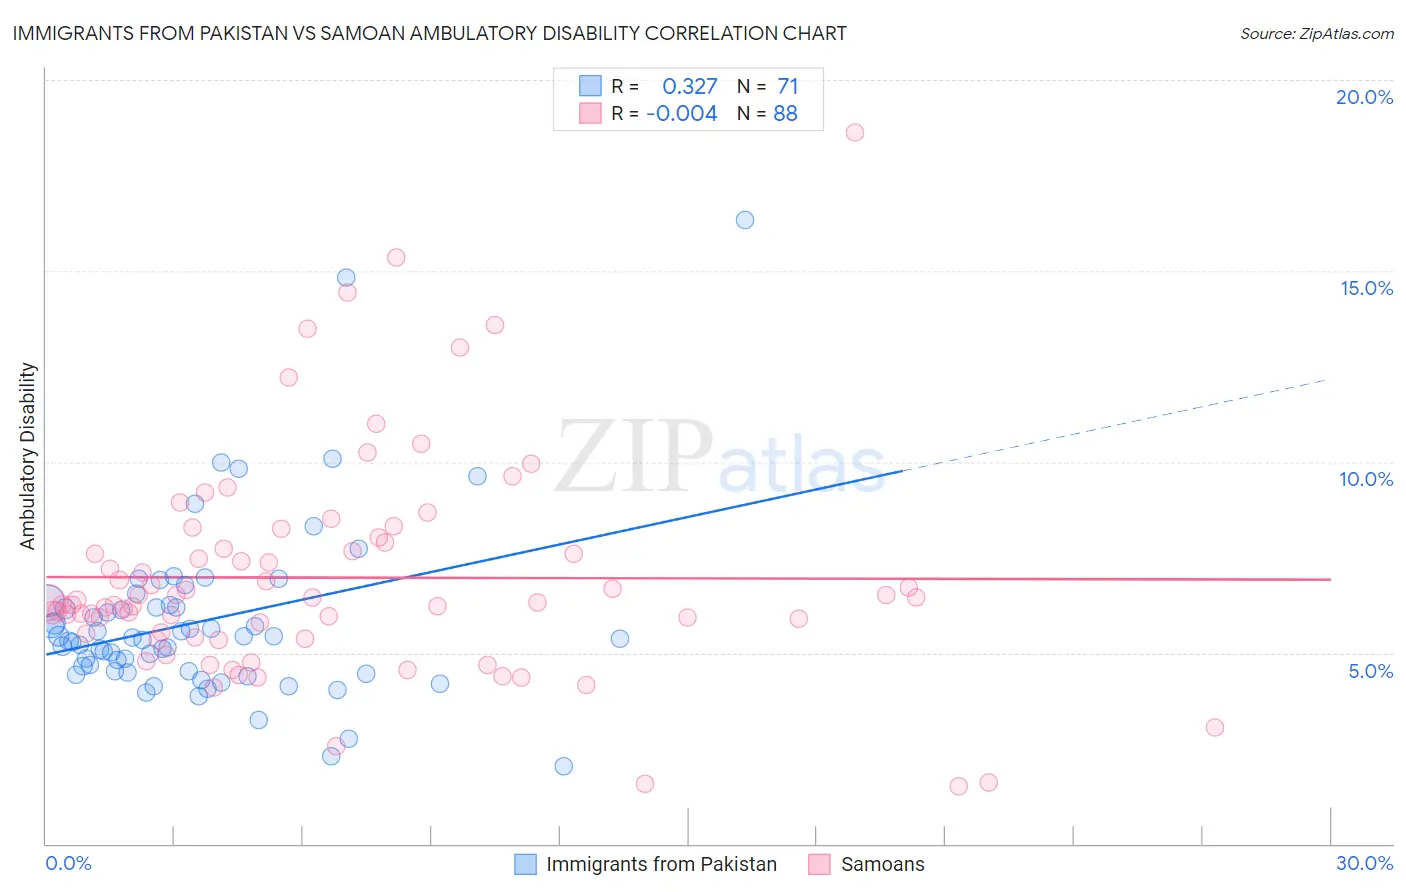
Immigrants from Pakistan vs Samoan Ambulatory Disability Correlation Chart
The statistical analysis conducted on geographies consisting of 283,855,056 people shows a mild positive correlation between the proportion of Immigrants from Pakistan and percentage of population with ambulatory disability in the United States with a correlation coefficient (R) of 0.327 and weighted average of 5.5%. Similarly, the statistical analysis conducted on geographies consisting of 225,059,815 people shows no correlation between the proportion of Samoans and percentage of population with ambulatory disability in the United States with a correlation coefficient (R) of -0.004 and weighted average of 6.3%, a difference of 14.9%.
Ambulatory Disability Correlation Summary
| Measurement | Immigrants from Pakistan | Samoan |
| Minimum | 2.0% | 1.5% |
| Maximum | 16.3% | 18.6% |
| Range | 14.3% | 17.1% |
| Mean | 5.8% | 7.0% |
| Median | 5.4% | 6.3% |
| Interquartile 25% (IQ1) | 4.5% | 5.5% |
| Interquartile 75% (IQ3) | 6.2% | 7.8% |
| Interquartile Range (IQR) | 1.7% | 2.3% |
| Standard Deviation (Sample) | 2.3% | 2.9% |
| Standard Deviation (Population) | 2.3% | 2.9% |
Similar Demographics by Ambulatory Disability
Demographics Similar to Immigrants from Pakistan by Ambulatory Disability
In terms of ambulatory disability, the demographic groups most similar to Immigrants from Pakistan are Immigrants from Australia (5.5%, a difference of 0.12%), Immigrants from Asia (5.5%, a difference of 0.16%), Afghan (5.5%, a difference of 0.20%), Immigrants from Malaysia (5.5%, a difference of 0.27%), and Turkish (5.5%, a difference of 0.28%).
| Demographics | Rating | Rank | Ambulatory Disability |
| Immigrants | Nepal | 100.0 /100 | #26 | Exceptional 5.4% |
| Asians | 100.0 /100 | #27 | Exceptional 5.4% |
| Cambodians | 100.0 /100 | #28 | Exceptional 5.4% |
| Immigrants | Iran | 100.0 /100 | #29 | Exceptional 5.4% |
| Immigrants | Turkey | 100.0 /100 | #30 | Exceptional 5.4% |
| Immigrants | Venezuela | 100.0 /100 | #31 | Exceptional 5.4% |
| Immigrants | Australia | 100.0 /100 | #32 | Exceptional 5.5% |
| Immigrants | Pakistan | 100.0 /100 | #33 | Exceptional 5.5% |
| Immigrants | Asia | 100.0 /100 | #34 | Exceptional 5.5% |
| Afghans | 100.0 /100 | #35 | Exceptional 5.5% |
| Immigrants | Malaysia | 100.0 /100 | #36 | Exceptional 5.5% |
| Turks | 100.0 /100 | #37 | Exceptional 5.5% |
| Cypriots | 100.0 /100 | #38 | Exceptional 5.5% |
| Immigrants | Eritrea | 100.0 /100 | #39 | Exceptional 5.5% |
| Venezuelans | 99.9 /100 | #40 | Exceptional 5.5% |
Demographics Similar to Samoans by Ambulatory Disability
In terms of ambulatory disability, the demographic groups most similar to Samoans are Mexican American Indian (6.3%, a difference of 0.010%), Japanese (6.3%, a difference of 0.010%), Immigrants from Mexico (6.3%, a difference of 0.13%), Immigrants from Laos (6.3%, a difference of 0.14%), and Immigrants from Latin America (6.3%, a difference of 0.14%).
| Demographics | Rating | Rank | Ambulatory Disability |
| Immigrants | Congo | 18.2 /100 | #204 | Poor 6.2% |
| Slovenes | 18.0 /100 | #205 | Poor 6.2% |
| Finns | 17.2 /100 | #206 | Poor 6.2% |
| Alsatians | 15.1 /100 | #207 | Poor 6.3% |
| Bangladeshis | 14.2 /100 | #208 | Poor 6.3% |
| Immigrants | Iraq | 14.0 /100 | #209 | Poor 6.3% |
| Immigrants | Laos | 13.2 /100 | #210 | Poor 6.3% |
| Samoans | 12.1 /100 | #211 | Poor 6.3% |
| Mexican American Indians | 12.0 /100 | #212 | Poor 6.3% |
| Japanese | 12.0 /100 | #213 | Poor 6.3% |
| Immigrants | Mexico | 11.0 /100 | #214 | Poor 6.3% |
| Immigrants | Latin America | 11.0 /100 | #215 | Poor 6.3% |
| Canadians | 10.9 /100 | #216 | Poor 6.3% |
| Yugoslavians | 10.9 /100 | #217 | Poor 6.3% |
| Guamanians/Chamorros | 10.6 /100 | #218 | Poor 6.3% |