Immigrants from Pakistan vs Taiwanese Male Disability
COMPARE
Immigrants from Pakistan
Taiwanese
Male Disability
Male Disability Comparison
Immigrants from Pakistan
Taiwanese
9.8%
MALE DISABILITY
100.0/ 100
METRIC RATING
18th/ 347
METRIC RANK
10.3%
MALE DISABILITY
99.8/ 100
METRIC RATING
41st/ 347
METRIC RANK
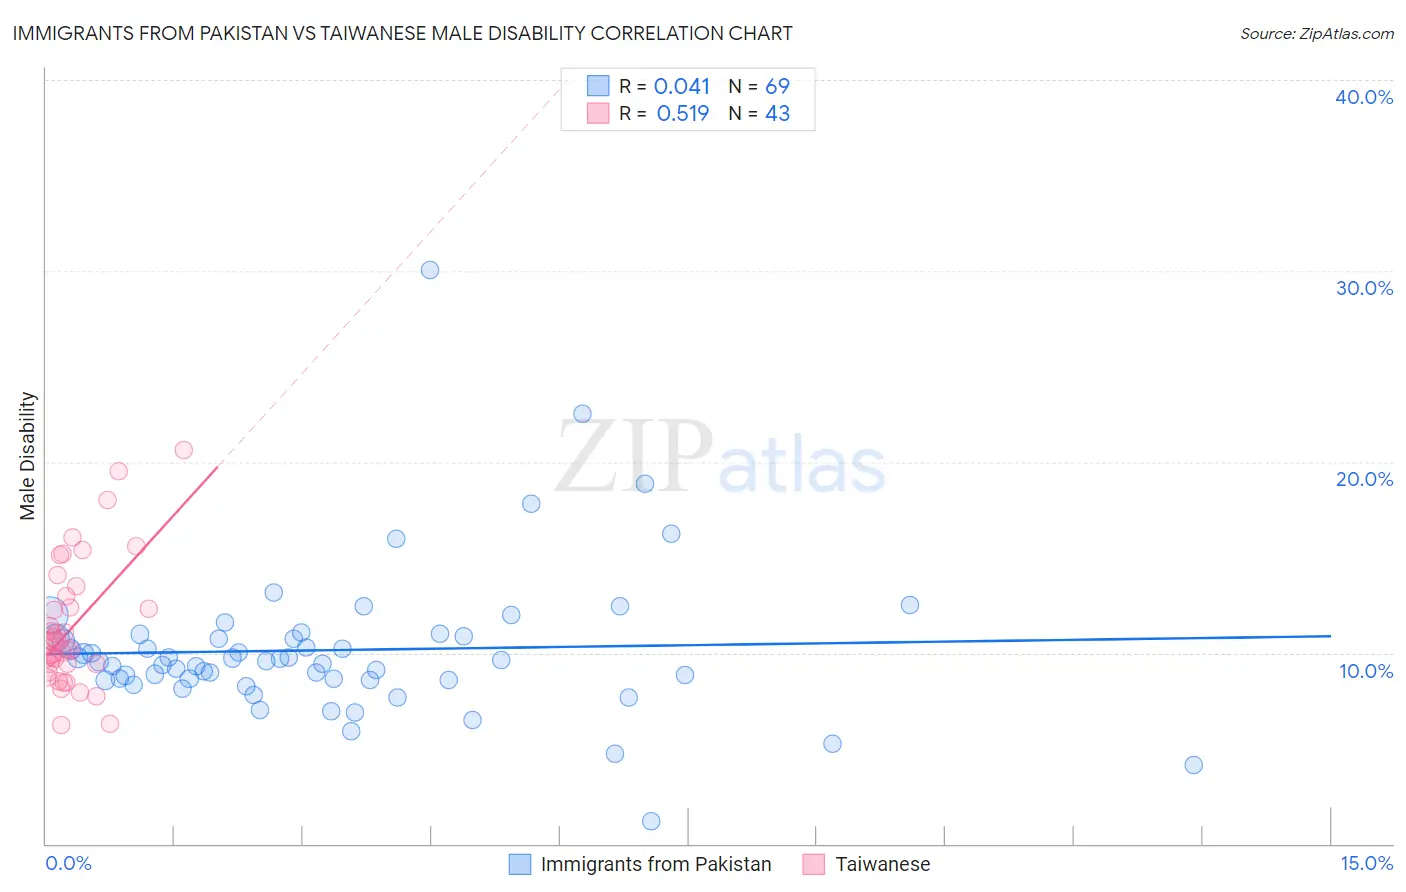
Immigrants from Pakistan vs Taiwanese Male Disability Correlation Chart
The statistical analysis conducted on geographies consisting of 283,893,374 people shows no correlation between the proportion of Immigrants from Pakistan and percentage of males with a disability in the United States with a correlation coefficient (R) of 0.041 and weighted average of 9.8%. Similarly, the statistical analysis conducted on geographies consisting of 31,723,465 people shows a substantial positive correlation between the proportion of Taiwanese and percentage of males with a disability in the United States with a correlation coefficient (R) of 0.519 and weighted average of 10.3%, a difference of 4.3%.
Male Disability Correlation Summary
| Measurement | Immigrants from Pakistan | Taiwanese |
| Minimum | 1.2% | 6.2% |
| Maximum | 30.0% | 20.6% |
| Range | 28.8% | 14.4% |
| Mean | 10.1% | 11.3% |
| Median | 9.6% | 10.5% |
| Interquartile 25% (IQ1) | 8.6% | 9.4% |
| Interquartile 75% (IQ3) | 10.8% | 12.9% |
| Interquartile Range (IQR) | 2.2% | 3.5% |
| Standard Deviation (Sample) | 4.0% | 3.3% |
| Standard Deviation (Population) | 4.0% | 3.3% |
Similar Demographics by Male Disability
Demographics Similar to Immigrants from Pakistan by Male Disability
In terms of male disability, the demographic groups most similar to Immigrants from Pakistan are Immigrants from Korea (9.8%, a difference of 0.56%), Okinawan (9.8%, a difference of 0.70%), Immigrants from Sri Lanka (10.0%, a difference of 1.2%), Asian (10.0%, a difference of 1.2%), and Indian (Asian) (9.7%, a difference of 1.3%).
| Demographics | Rating | Rank | Male Disability |
| Immigrants | Eastern Asia | 100.0 /100 | #11 | Exceptional 9.6% |
| Bolivians | 100.0 /100 | #12 | Exceptional 9.6% |
| Iranians | 100.0 /100 | #13 | Exceptional 9.7% |
| Immigrants | Iran | 100.0 /100 | #14 | Exceptional 9.7% |
| Indians (Asian) | 100.0 /100 | #15 | Exceptional 9.7% |
| Okinawans | 100.0 /100 | #16 | Exceptional 9.8% |
| Immigrants | Korea | 100.0 /100 | #17 | Exceptional 9.8% |
| Immigrants | Pakistan | 100.0 /100 | #18 | Exceptional 9.8% |
| Immigrants | Sri Lanka | 100.0 /100 | #19 | Exceptional 10.0% |
| Asians | 100.0 /100 | #20 | Exceptional 10.0% |
| Burmese | 100.0 /100 | #21 | Exceptional 10.0% |
| Immigrants | Venezuela | 100.0 /100 | #22 | Exceptional 10.0% |
| Cypriots | 100.0 /100 | #23 | Exceptional 10.0% |
| Immigrants | Asia | 100.0 /100 | #24 | Exceptional 10.0% |
| Immigrants | Malaysia | 99.9 /100 | #25 | Exceptional 10.0% |
Demographics Similar to Taiwanese by Male Disability
In terms of male disability, the demographic groups most similar to Taiwanese are Immigrants from Nepal (10.3%, a difference of 0.0%), Afghan (10.2%, a difference of 0.19%), Mongolian (10.3%, a difference of 0.25%), Immigrants from Bangladesh (10.3%, a difference of 0.27%), and Immigrants from Kuwait (10.2%, a difference of 0.35%).
| Demographics | Rating | Rank | Male Disability |
| Immigrants | Turkey | 99.9 /100 | #34 | Exceptional 10.2% |
| Immigrants | Argentina | 99.9 /100 | #35 | Exceptional 10.2% |
| Ethiopians | 99.8 /100 | #36 | Exceptional 10.2% |
| Immigrants | Indonesia | 99.8 /100 | #37 | Exceptional 10.2% |
| Immigrants | Kuwait | 99.8 /100 | #38 | Exceptional 10.2% |
| Afghans | 99.8 /100 | #39 | Exceptional 10.2% |
| Immigrants | Nepal | 99.8 /100 | #40 | Exceptional 10.3% |
| Taiwanese | 99.8 /100 | #41 | Exceptional 10.3% |
| Mongolians | 99.7 /100 | #42 | Exceptional 10.3% |
| Immigrants | Bangladesh | 99.7 /100 | #43 | Exceptional 10.3% |
| Immigrants | El Salvador | 99.7 /100 | #44 | Exceptional 10.3% |
| Turks | 99.7 /100 | #45 | Exceptional 10.3% |
| Cambodians | 99.7 /100 | #46 | Exceptional 10.3% |
| Immigrants | Peru | 99.7 /100 | #47 | Exceptional 10.3% |
| Israelis | 99.7 /100 | #48 | Exceptional 10.3% |