Immigrants from Pakistan vs Choctaw Male Disability
COMPARE
Immigrants from Pakistan
Choctaw
Male Disability
Male Disability Comparison
Immigrants from Pakistan
Choctaw
9.8%
MALE DISABILITY
100.0/ 100
METRIC RATING
18th/ 347
METRIC RANK
15.4%
MALE DISABILITY
0.0/ 100
METRIC RATING
341st/ 347
METRIC RANK
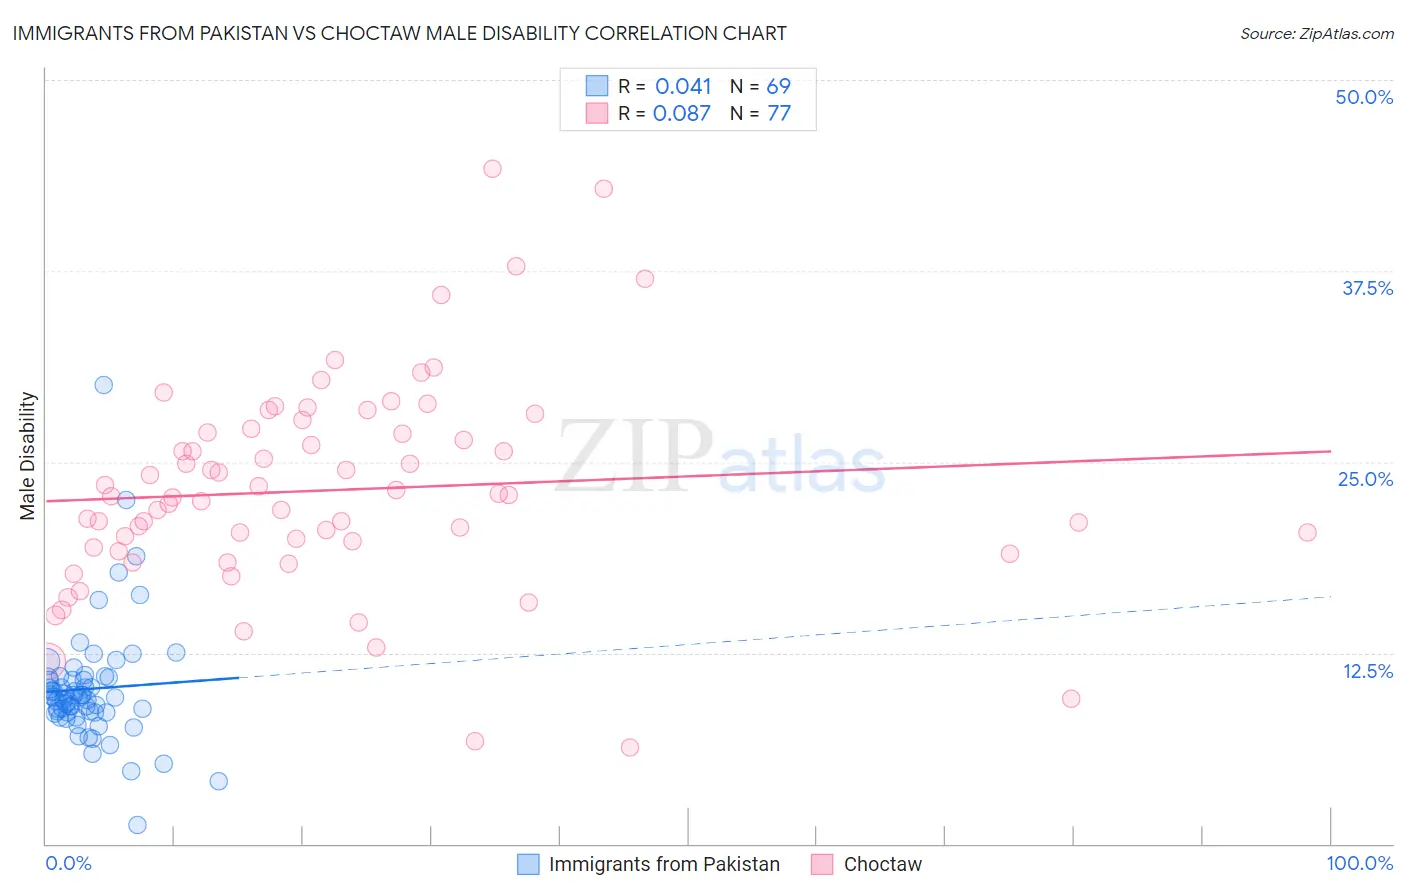
Immigrants from Pakistan vs Choctaw Male Disability Correlation Chart
The statistical analysis conducted on geographies consisting of 283,893,374 people shows no correlation between the proportion of Immigrants from Pakistan and percentage of males with a disability in the United States with a correlation coefficient (R) of 0.041 and weighted average of 9.8%. Similarly, the statistical analysis conducted on geographies consisting of 269,660,738 people shows a slight positive correlation between the proportion of Choctaw and percentage of males with a disability in the United States with a correlation coefficient (R) of 0.087 and weighted average of 15.4%, a difference of 56.4%.
Male Disability Correlation Summary
| Measurement | Immigrants from Pakistan | Choctaw |
| Minimum | 1.2% | 6.3% |
| Maximum | 30.0% | 44.2% |
| Range | 28.8% | 38.0% |
| Mean | 10.1% | 23.1% |
| Median | 9.6% | 22.8% |
| Interquartile 25% (IQ1) | 8.6% | 19.3% |
| Interquartile 75% (IQ3) | 10.8% | 27.0% |
| Interquartile Range (IQR) | 2.2% | 7.8% |
| Standard Deviation (Sample) | 4.0% | 7.0% |
| Standard Deviation (Population) | 4.0% | 6.9% |
Similar Demographics by Male Disability
Demographics Similar to Immigrants from Pakistan by Male Disability
In terms of male disability, the demographic groups most similar to Immigrants from Pakistan are Immigrants from Korea (9.8%, a difference of 0.56%), Okinawan (9.8%, a difference of 0.70%), Immigrants from Sri Lanka (10.0%, a difference of 1.2%), Asian (10.0%, a difference of 1.2%), and Indian (Asian) (9.7%, a difference of 1.3%).
| Demographics | Rating | Rank | Male Disability |
| Immigrants | Eastern Asia | 100.0 /100 | #11 | Exceptional 9.6% |
| Bolivians | 100.0 /100 | #12 | Exceptional 9.6% |
| Iranians | 100.0 /100 | #13 | Exceptional 9.7% |
| Immigrants | Iran | 100.0 /100 | #14 | Exceptional 9.7% |
| Indians (Asian) | 100.0 /100 | #15 | Exceptional 9.7% |
| Okinawans | 100.0 /100 | #16 | Exceptional 9.8% |
| Immigrants | Korea | 100.0 /100 | #17 | Exceptional 9.8% |
| Immigrants | Pakistan | 100.0 /100 | #18 | Exceptional 9.8% |
| Immigrants | Sri Lanka | 100.0 /100 | #19 | Exceptional 10.0% |
| Asians | 100.0 /100 | #20 | Exceptional 10.0% |
| Burmese | 100.0 /100 | #21 | Exceptional 10.0% |
| Immigrants | Venezuela | 100.0 /100 | #22 | Exceptional 10.0% |
| Cypriots | 100.0 /100 | #23 | Exceptional 10.0% |
| Immigrants | Asia | 100.0 /100 | #24 | Exceptional 10.0% |
| Immigrants | Malaysia | 99.9 /100 | #25 | Exceptional 10.0% |
Demographics Similar to Choctaw by Male Disability
In terms of male disability, the demographic groups most similar to Choctaw are Kiowa (15.4%, a difference of 0.19%), Creek (15.5%, a difference of 0.85%), Puerto Rican (15.6%, a difference of 0.98%), Lumbee (15.2%, a difference of 1.1%), and Tsimshian (15.6%, a difference of 1.3%).
| Demographics | Rating | Rank | Male Disability |
| Yuman | 0.0 /100 | #333 | Tragic 14.7% |
| Cherokee | 0.0 /100 | #334 | Tragic 14.8% |
| Dutch West Indians | 0.0 /100 | #335 | Tragic 14.8% |
| Alaskan Athabascans | 0.0 /100 | #336 | Tragic 14.9% |
| Menominee | 0.0 /100 | #337 | Tragic 15.0% |
| Pueblo | 0.0 /100 | #338 | Tragic 15.0% |
| Chickasaw | 0.0 /100 | #339 | Tragic 15.1% |
| Lumbee | 0.0 /100 | #340 | Tragic 15.2% |
| Choctaw | 0.0 /100 | #341 | Tragic 15.4% |
| Kiowa | 0.0 /100 | #342 | Tragic 15.4% |
| Creek | 0.0 /100 | #343 | Tragic 15.5% |
| Puerto Ricans | 0.0 /100 | #344 | Tragic 15.6% |
| Tsimshian | 0.0 /100 | #345 | Tragic 15.6% |
| Colville | 0.0 /100 | #346 | Tragic 16.5% |
| Houma | 0.0 /100 | #347 | Tragic 17.4% |