Immigrants from Pakistan vs Immigrants from Europe Unemployment Among Women with Children Under 6 years
COMPARE
Immigrants from Pakistan
Immigrants from Europe
Unemployment Among Women with Children Under 6 years
Unemployment Among Women with Children Under 6 years Comparison
Immigrants from Pakistan
Immigrants from Europe
7.2%
UNEMPLOYMENT AMONG WOMEN WITH CHILDREN UNDER 6 YEARS
97.2/ 100
METRIC RATING
106th/ 347
METRIC RANK
7.2%
UNEMPLOYMENT AMONG WOMEN WITH CHILDREN UNDER 6 YEARS
97.5/ 100
METRIC RATING
99th/ 347
METRIC RANK
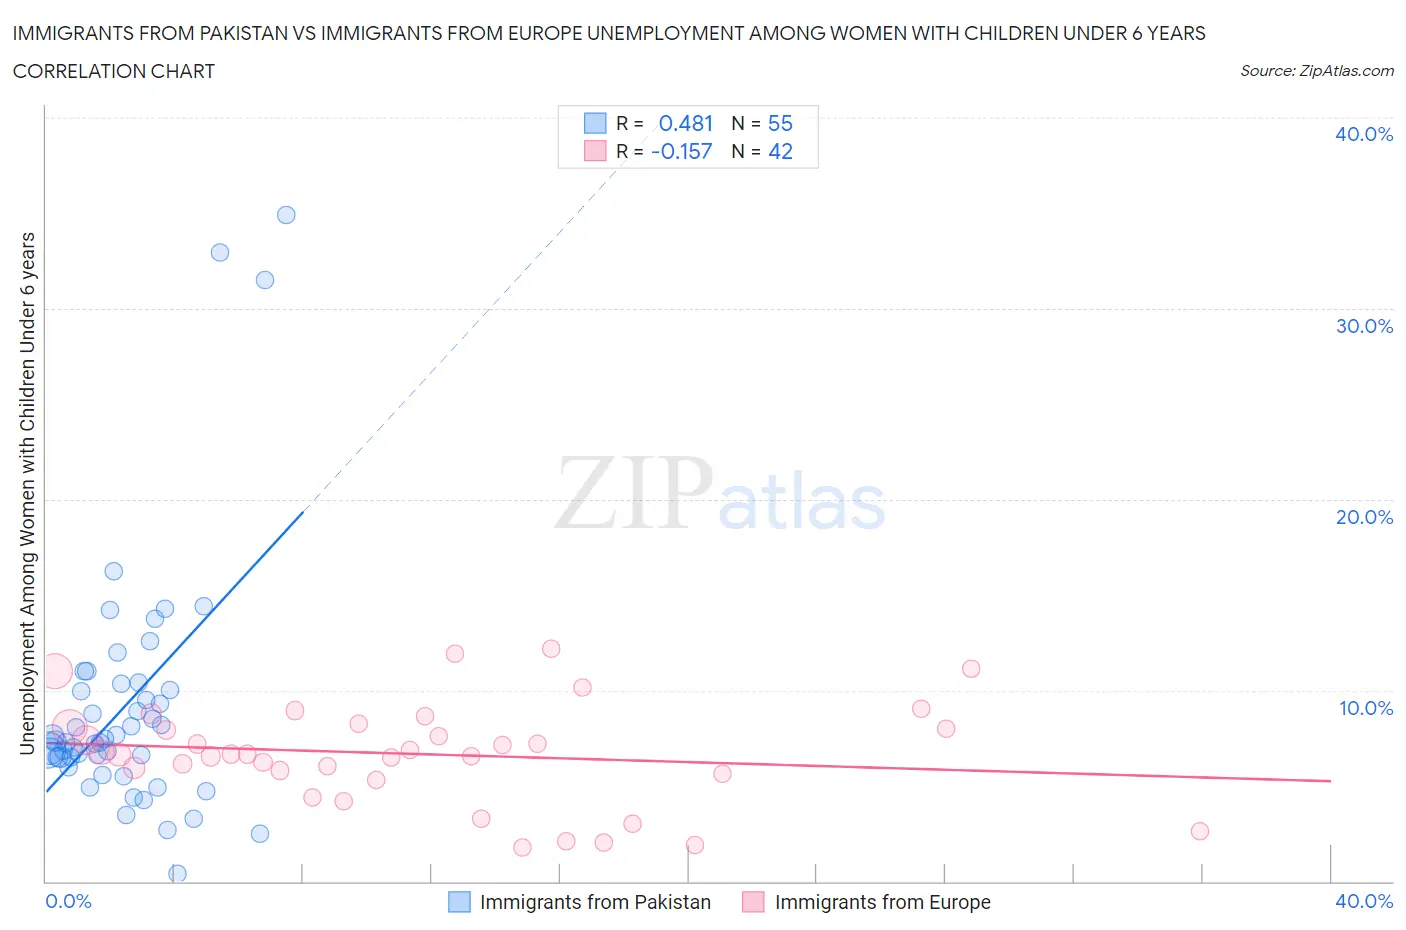
Immigrants from Pakistan vs Immigrants from Europe Unemployment Among Women with Children Under 6 years Correlation Chart
The statistical analysis conducted on geographies consisting of 233,137,568 people shows a moderate positive correlation between the proportion of Immigrants from Pakistan and unemployment rate among women with children under the age of 6 in the United States with a correlation coefficient (R) of 0.481 and weighted average of 7.2%. Similarly, the statistical analysis conducted on geographies consisting of 372,239,428 people shows a poor negative correlation between the proportion of Immigrants from Europe and unemployment rate among women with children under the age of 6 in the United States with a correlation coefficient (R) of -0.157 and weighted average of 7.2%, a difference of 0.20%.
Unemployment Among Women with Children Under 6 years Correlation Summary
| Measurement | Immigrants from Pakistan | Immigrants from Europe |
| Minimum | 0.40% | 1.8% |
| Maximum | 34.9% | 12.2% |
| Range | 34.5% | 10.4% |
| Mean | 9.2% | 6.7% |
| Median | 7.3% | 6.7% |
| Interquartile 25% (IQ1) | 6.5% | 5.6% |
| Interquartile 75% (IQ3) | 10.3% | 8.1% |
| Interquartile Range (IQR) | 3.8% | 2.5% |
| Standard Deviation (Sample) | 6.6% | 2.6% |
| Standard Deviation (Population) | 6.6% | 2.6% |
Demographics Similar to Immigrants from Pakistan and Immigrants from Europe by Unemployment Among Women with Children Under 6 years
In terms of unemployment among women with children under 6 years, the demographic groups most similar to Immigrants from Pakistan are Venezuelan (7.2%, a difference of 0.010%), Immigrants from Kazakhstan (7.2%, a difference of 0.020%), Immigrants from Egypt (7.2%, a difference of 0.030%), Immigrants from Saudi Arabia (7.2%, a difference of 0.10%), and Immigrants from Nicaragua (7.2%, a difference of 0.11%). Similarly, the demographic groups most similar to Immigrants from Europe are Russian (7.2%, a difference of 0.040%), Immigrants from Northern Europe (7.2%, a difference of 0.040%), Immigrants from South Eastern Asia (7.2%, a difference of 0.070%), Chilean (7.2%, a difference of 0.070%), and Immigrants from Nicaragua (7.2%, a difference of 0.10%).
| Demographics | Rating | Rank | Unemployment Among Women with Children Under 6 years |
| Albanians | 98.0 /100 | #92 | Exceptional 7.2% |
| New Zealanders | 97.8 /100 | #93 | Exceptional 7.2% |
| Macedonians | 97.7 /100 | #94 | Exceptional 7.2% |
| Romanians | 97.7 /100 | #95 | Exceptional 7.2% |
| Immigrants | Eastern Africa | 97.7 /100 | #96 | Exceptional 7.2% |
| Immigrants | South Eastern Asia | 97.6 /100 | #97 | Exceptional 7.2% |
| Russians | 97.5 /100 | #98 | Exceptional 7.2% |
| Immigrants | Europe | 97.5 /100 | #99 | Exceptional 7.2% |
| Immigrants | Northern Europe | 97.4 /100 | #100 | Exceptional 7.2% |
| Chileans | 97.4 /100 | #101 | Exceptional 7.2% |
| Immigrants | Nicaragua | 97.3 /100 | #102 | Exceptional 7.2% |
| Immigrants | Saudi Arabia | 97.3 /100 | #103 | Exceptional 7.2% |
| Immigrants | Egypt | 97.2 /100 | #104 | Exceptional 7.2% |
| Venezuelans | 97.2 /100 | #105 | Exceptional 7.2% |
| Immigrants | Pakistan | 97.2 /100 | #106 | Exceptional 7.2% |
| Immigrants | Kazakhstan | 97.1 /100 | #107 | Exceptional 7.2% |
| Eastern Europeans | 96.9 /100 | #108 | Exceptional 7.2% |
| Australians | 96.9 /100 | #109 | Exceptional 7.2% |
| Palestinians | 96.8 /100 | #110 | Exceptional 7.2% |
| Norwegians | 96.7 /100 | #111 | Exceptional 7.2% |
| Israelis | 96.5 /100 | #112 | Exceptional 7.2% |