Immigrants from Oceania vs Celtic Disability Age Under 5
COMPARE
Immigrants from Oceania
Celtic
Disability Age Under 5
Disability Age Under 5 Comparison
Immigrants from Oceania
Celtics
1.2%
DISABILITY AGE UNDER 5
94.2/ 100
METRIC RATING
113th/ 347
METRIC RANK
1.7%
DISABILITY AGE UNDER 5
0.0/ 100
METRIC RATING
313th/ 347
METRIC RANK
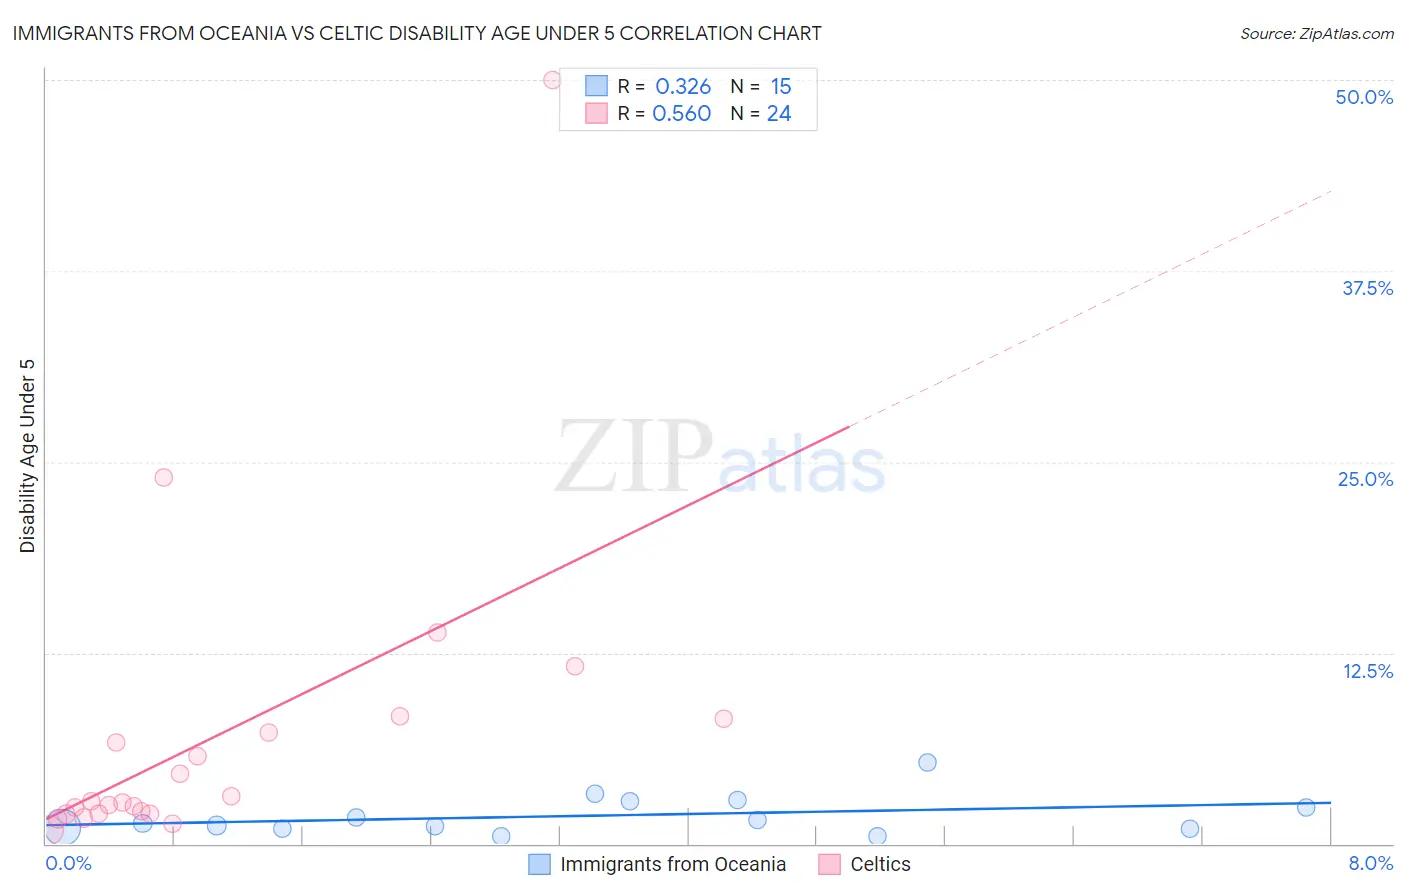
Immigrants from Oceania vs Celtic Disability Age Under 5 Correlation Chart
The statistical analysis conducted on geographies consisting of 180,365,611 people shows a mild positive correlation between the proportion of Immigrants from Oceania and percentage of population with a disability under the age of 5 in the United States with a correlation coefficient (R) of 0.326 and weighted average of 1.2%. Similarly, the statistical analysis conducted on geographies consisting of 116,047,957 people shows a substantial positive correlation between the proportion of Celtics and percentage of population with a disability under the age of 5 in the United States with a correlation coefficient (R) of 0.560 and weighted average of 1.7%, a difference of 44.1%.
Disability Age Under 5 Correlation Summary
| Measurement | Immigrants from Oceania | Celtic |
| Minimum | 0.49% | 0.88% |
| Maximum | 5.3% | 50.0% |
| Range | 4.9% | 49.1% |
| Mean | 1.9% | 7.1% |
| Median | 1.3% | 2.8% |
| Interquartile 25% (IQ1) | 1.0% | 2.0% |
| Interquartile 75% (IQ3) | 2.8% | 7.7% |
| Interquartile Range (IQR) | 1.8% | 5.7% |
| Standard Deviation (Sample) | 1.3% | 10.5% |
| Standard Deviation (Population) | 1.2% | 10.3% |
Similar Demographics by Disability Age Under 5
Demographics Similar to Immigrants from Oceania by Disability Age Under 5
In terms of disability age under 5, the demographic groups most similar to Immigrants from Oceania are Immigrants from Australia (1.2%, a difference of 0.060%), Belizean (1.2%, a difference of 0.15%), Immigrants from Caribbean (1.2%, a difference of 0.16%), Senegalese (1.2%, a difference of 0.17%), and Immigrants from Northern Africa (1.2%, a difference of 0.18%).
| Demographics | Rating | Rank | Disability Age Under 5 |
| Cambodians | 95.4 /100 | #106 | Exceptional 1.2% |
| Immigrants | West Indies | 95.3 /100 | #107 | Exceptional 1.2% |
| Iraqis | 95.1 /100 | #108 | Exceptional 1.2% |
| Immigrants | Panama | 95.0 /100 | #109 | Exceptional 1.2% |
| Immigrants | Lebanon | 95.0 /100 | #110 | Exceptional 1.2% |
| Senegalese | 94.6 /100 | #111 | Exceptional 1.2% |
| Immigrants | Australia | 94.4 /100 | #112 | Exceptional 1.2% |
| Immigrants | Oceania | 94.2 /100 | #113 | Exceptional 1.2% |
| Belizeans | 93.9 /100 | #114 | Exceptional 1.2% |
| Immigrants | Caribbean | 93.8 /100 | #115 | Exceptional 1.2% |
| Immigrants | Northern Africa | 93.8 /100 | #116 | Exceptional 1.2% |
| Immigrants | Philippines | 93.5 /100 | #117 | Exceptional 1.2% |
| Immigrants | Venezuela | 93.4 /100 | #118 | Exceptional 1.2% |
| Bhutanese | 92.5 /100 | #119 | Exceptional 1.2% |
| Immigrants | Eritrea | 92.3 /100 | #120 | Exceptional 1.2% |
Demographics Similar to Celtics by Disability Age Under 5
In terms of disability age under 5, the demographic groups most similar to Celtics are Puerto Rican (1.7%, a difference of 0.16%), Norwegian (1.7%, a difference of 0.16%), English (1.7%, a difference of 0.20%), Dutch (1.7%, a difference of 0.42%), and Immigrants from Cabo Verde (1.7%, a difference of 0.60%).
| Demographics | Rating | Rank | Disability Age Under 5 |
| Creek | 0.0 /100 | #306 | Tragic 1.6% |
| Scottish | 0.0 /100 | #307 | Tragic 1.6% |
| Navajo | 0.0 /100 | #308 | Tragic 1.6% |
| Cape Verdeans | 0.0 /100 | #309 | Tragic 1.7% |
| Whites/Caucasians | 0.0 /100 | #310 | Tragic 1.7% |
| English | 0.0 /100 | #311 | Tragic 1.7% |
| Puerto Ricans | 0.0 /100 | #312 | Tragic 1.7% |
| Celtics | 0.0 /100 | #313 | Tragic 1.7% |
| Norwegians | 0.0 /100 | #314 | Tragic 1.7% |
| Dutch | 0.0 /100 | #315 | Tragic 1.7% |
| Immigrants | Cabo Verde | 0.0 /100 | #316 | Tragic 1.7% |
| French | 0.0 /100 | #317 | Tragic 1.7% |
| Irish | 0.0 /100 | #318 | Tragic 1.7% |
| Slovaks | 0.0 /100 | #319 | Tragic 1.7% |
| Scotch-Irish | 0.0 /100 | #320 | Tragic 1.7% |