Carpatho Rusyn vs Thai Male Disability
COMPARE
Carpatho Rusyn
Thai
Male Disability
Male Disability Comparison
Carpatho Rusyns
Thais
11.9%
MALE DISABILITY
1.3/ 100
METRIC RATING
237th/ 347
METRIC RANK
9.2%
MALE DISABILITY
100.0/ 100
METRIC RATING
4th/ 347
METRIC RANK
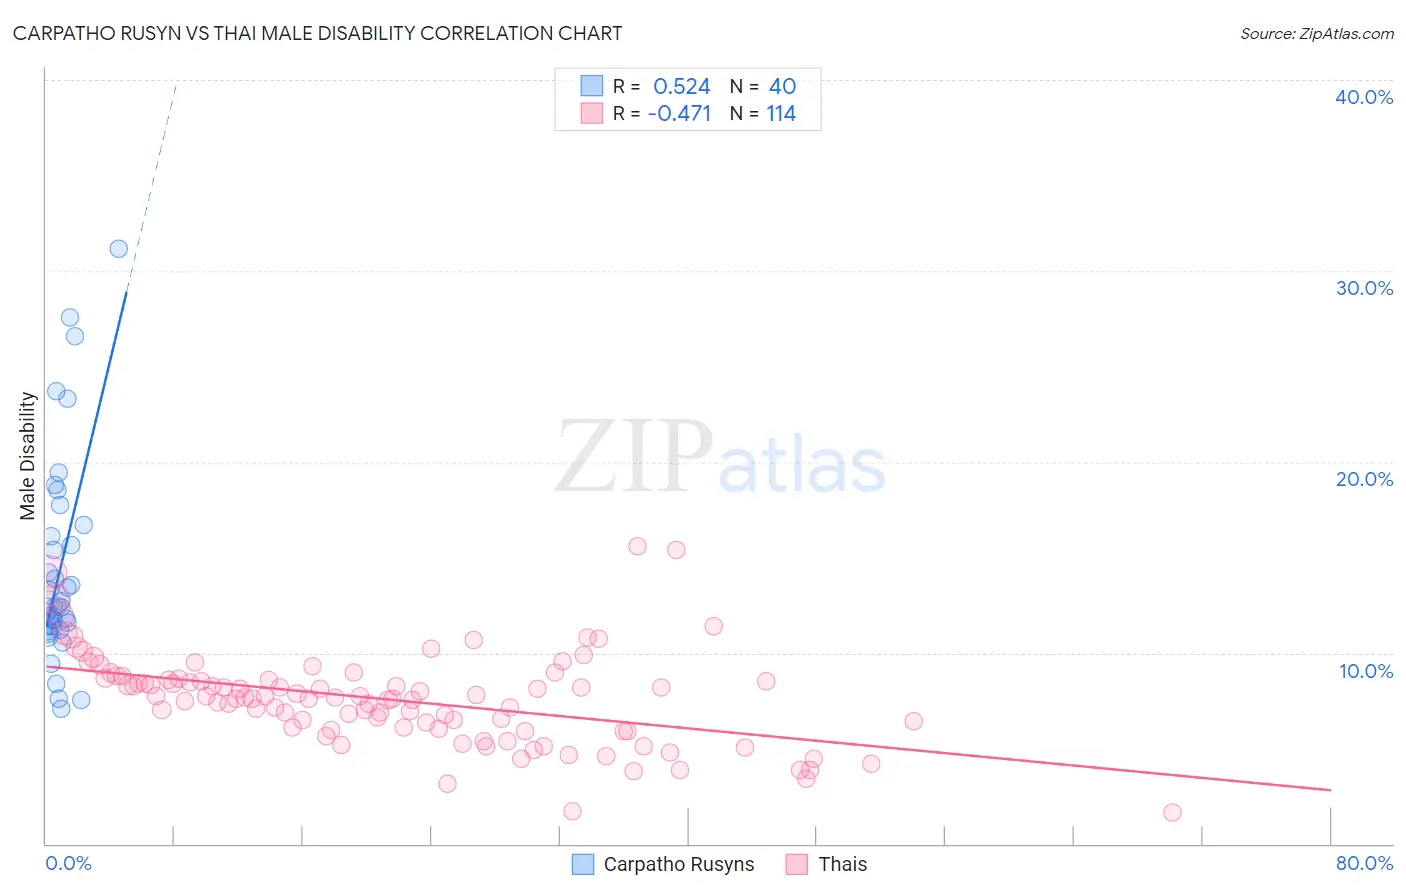
Carpatho Rusyn vs Thai Male Disability Correlation Chart
The statistical analysis conducted on geographies consisting of 58,870,293 people shows a substantial positive correlation between the proportion of Carpatho Rusyns and percentage of males with a disability in the United States with a correlation coefficient (R) of 0.524 and weighted average of 11.9%. Similarly, the statistical analysis conducted on geographies consisting of 475,773,320 people shows a moderate negative correlation between the proportion of Thais and percentage of males with a disability in the United States with a correlation coefficient (R) of -0.471 and weighted average of 9.2%, a difference of 28.8%.
Male Disability Correlation Summary
| Measurement | Carpatho Rusyn | Thai |
| Minimum | 7.0% | 1.6% |
| Maximum | 31.1% | 15.6% |
| Range | 24.1% | 14.0% |
| Mean | 14.4% | 7.5% |
| Median | 12.4% | 7.6% |
| Interquartile 25% (IQ1) | 11.3% | 6.0% |
| Interquartile 75% (IQ3) | 16.4% | 8.6% |
| Interquartile Range (IQR) | 5.1% | 2.5% |
| Standard Deviation (Sample) | 5.5% | 2.4% |
| Standard Deviation (Population) | 5.5% | 2.4% |
Similar Demographics by Male Disability
Demographics Similar to Carpatho Rusyns by Male Disability
In terms of male disability, the demographic groups most similar to Carpatho Rusyns are U.S. Virgin Islander (11.9%, a difference of 0.010%), Yugoslavian (11.9%, a difference of 0.10%), Immigrants from North America (11.9%, a difference of 0.15%), Italian (11.9%, a difference of 0.15%), and Czech (11.9%, a difference of 0.20%).
| Demographics | Rating | Rank | Male Disability |
| Croatians | 2.1 /100 | #230 | Tragic 11.8% |
| Dominicans | 1.8 /100 | #231 | Tragic 11.8% |
| Malaysians | 1.8 /100 | #232 | Tragic 11.8% |
| Mexicans | 1.7 /100 | #233 | Tragic 11.8% |
| Immigrants | Canada | 1.6 /100 | #234 | Tragic 11.9% |
| Immigrants | North America | 1.5 /100 | #235 | Tragic 11.9% |
| U.S. Virgin Islanders | 1.3 /100 | #236 | Tragic 11.9% |
| Carpatho Rusyns | 1.3 /100 | #237 | Tragic 11.9% |
| Yugoslavians | 1.2 /100 | #238 | Tragic 11.9% |
| Italians | 1.2 /100 | #239 | Tragic 11.9% |
| Czechs | 1.1 /100 | #240 | Tragic 11.9% |
| Bahamians | 1.1 /100 | #241 | Tragic 11.9% |
| Northern Europeans | 1.1 /100 | #242 | Tragic 11.9% |
| Samoans | 1.1 /100 | #243 | Tragic 11.9% |
| Immigrants | Laos | 1.0 /100 | #244 | Tragic 11.9% |
Demographics Similar to Thais by Male Disability
In terms of male disability, the demographic groups most similar to Thais are Filipino (9.1%, a difference of 1.3%), Immigrants from Taiwan (9.1%, a difference of 1.3%), Immigrants from Hong Kong (9.4%, a difference of 2.1%), Immigrants from South Central Asia (9.4%, a difference of 2.2%), and Immigrants from India (9.0%, a difference of 2.2%).
| Demographics | Rating | Rank | Male Disability |
| Immigrants | India | 100.0 /100 | #1 | Exceptional 9.0% |
| Immigrants | Taiwan | 100.0 /100 | #2 | Exceptional 9.1% |
| Filipinos | 100.0 /100 | #3 | Exceptional 9.1% |
| Thais | 100.0 /100 | #4 | Exceptional 9.2% |
| Immigrants | Hong Kong | 100.0 /100 | #5 | Exceptional 9.4% |
| Immigrants | South Central Asia | 100.0 /100 | #6 | Exceptional 9.4% |
| Immigrants | Bolivia | 100.0 /100 | #7 | Exceptional 9.5% |
| Immigrants | China | 100.0 /100 | #8 | Exceptional 9.5% |
| Immigrants | Singapore | 100.0 /100 | #9 | Exceptional 9.5% |
| Immigrants | Israel | 100.0 /100 | #10 | Exceptional 9.6% |
| Immigrants | Eastern Asia | 100.0 /100 | #11 | Exceptional 9.6% |
| Bolivians | 100.0 /100 | #12 | Exceptional 9.6% |
| Iranians | 100.0 /100 | #13 | Exceptional 9.7% |
| Immigrants | Iran | 100.0 /100 | #14 | Exceptional 9.7% |
| Indians (Asian) | 100.0 /100 | #15 | Exceptional 9.7% |