Immigrants from Belarus vs Thai Male Disability
COMPARE
Immigrants from Belarus
Thai
Male Disability
Male Disability Comparison
Immigrants from Belarus
Thais
10.4%
MALE DISABILITY
99.3/ 100
METRIC RATING
63rd/ 347
METRIC RANK
9.2%
MALE DISABILITY
100.0/ 100
METRIC RATING
4th/ 347
METRIC RANK
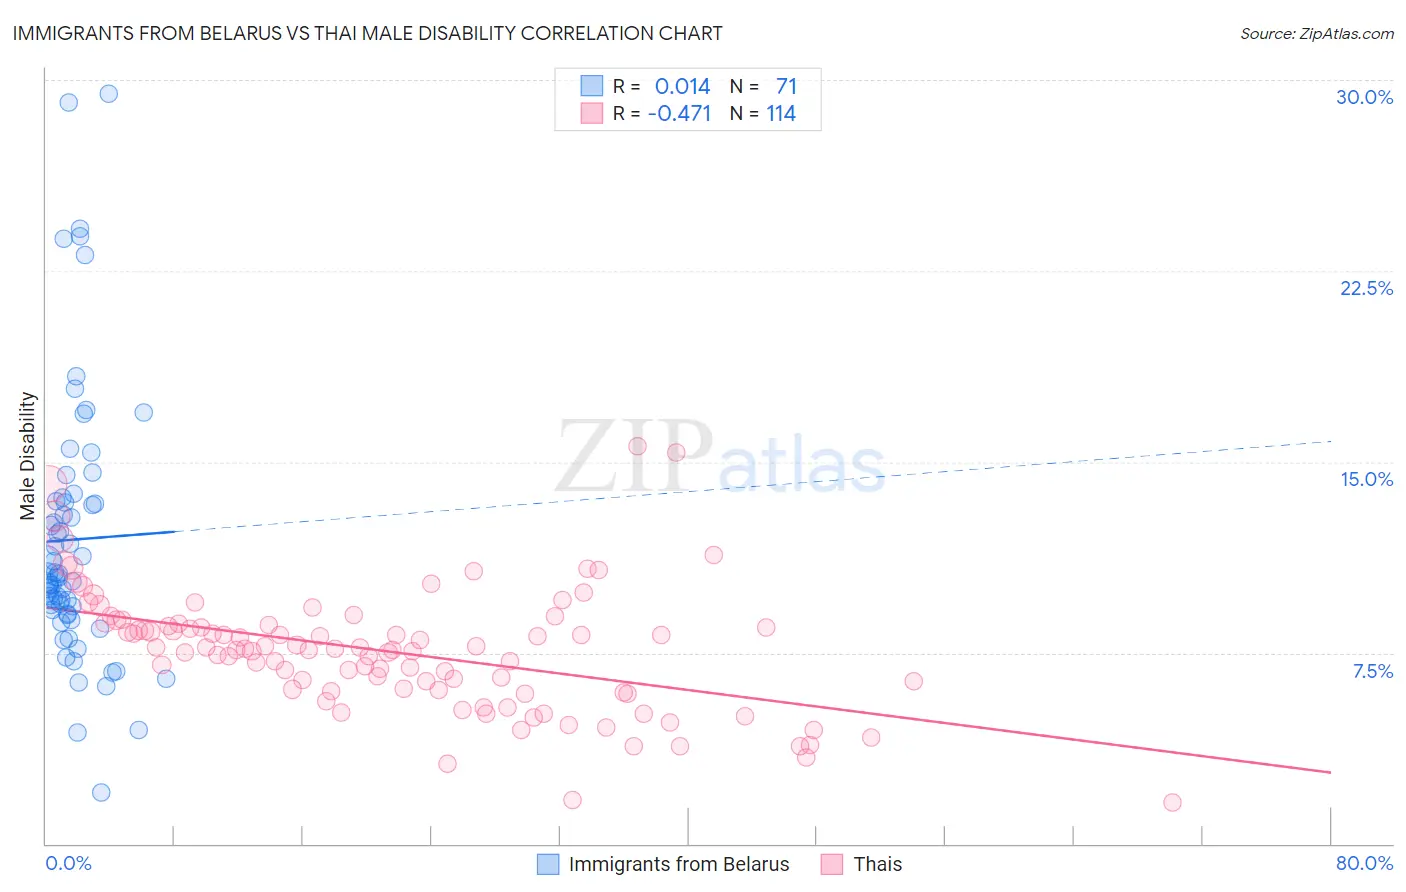
Immigrants from Belarus vs Thai Male Disability Correlation Chart
The statistical analysis conducted on geographies consisting of 150,193,333 people shows no correlation between the proportion of Immigrants from Belarus and percentage of males with a disability in the United States with a correlation coefficient (R) of 0.014 and weighted average of 10.4%. Similarly, the statistical analysis conducted on geographies consisting of 475,773,320 people shows a moderate negative correlation between the proportion of Thais and percentage of males with a disability in the United States with a correlation coefficient (R) of -0.471 and weighted average of 9.2%, a difference of 13.2%.
Male Disability Correlation Summary
| Measurement | Immigrants from Belarus | Thai |
| Minimum | 2.0% | 1.6% |
| Maximum | 29.5% | 15.6% |
| Range | 27.4% | 14.0% |
| Mean | 11.9% | 7.5% |
| Median | 10.5% | 7.6% |
| Interquartile 25% (IQ1) | 9.0% | 6.0% |
| Interquartile 75% (IQ3) | 13.5% | 8.6% |
| Interquartile Range (IQR) | 4.4% | 2.5% |
| Standard Deviation (Sample) | 5.3% | 2.4% |
| Standard Deviation (Population) | 5.2% | 2.4% |
Similar Demographics by Male Disability
Demographics Similar to Immigrants from Belarus by Male Disability
In terms of male disability, the demographic groups most similar to Immigrants from Belarus are Immigrants from Ecuador (10.4%, a difference of 0.020%), Jordanian (10.5%, a difference of 0.12%), Immigrants from Grenada (10.5%, a difference of 0.15%), Guyanese (10.5%, a difference of 0.15%), and Immigrants from Afghanistan (10.5%, a difference of 0.16%).
| Demographics | Rating | Rank | Male Disability |
| Tongans | 99.6 /100 | #56 | Exceptional 10.4% |
| Immigrants | South America | 99.6 /100 | #57 | Exceptional 10.4% |
| Immigrants | Japan | 99.5 /100 | #58 | Exceptional 10.4% |
| Immigrants | Australia | 99.5 /100 | #59 | Exceptional 10.4% |
| Immigrants | Colombia | 99.5 /100 | #60 | Exceptional 10.4% |
| Immigrants | Northern Africa | 99.4 /100 | #61 | Exceptional 10.4% |
| Immigrants | Ecuador | 99.3 /100 | #62 | Exceptional 10.4% |
| Immigrants | Belarus | 99.3 /100 | #63 | Exceptional 10.4% |
| Jordanians | 99.3 /100 | #64 | Exceptional 10.5% |
| Immigrants | Grenada | 99.2 /100 | #65 | Exceptional 10.5% |
| Guyanese | 99.2 /100 | #66 | Exceptional 10.5% |
| Immigrants | Afghanistan | 99.2 /100 | #67 | Exceptional 10.5% |
| Colombians | 99.2 /100 | #68 | Exceptional 10.5% |
| Ecuadorians | 99.2 /100 | #69 | Exceptional 10.5% |
| Immigrants | Bulgaria | 99.1 /100 | #70 | Exceptional 10.5% |
Demographics Similar to Thais by Male Disability
In terms of male disability, the demographic groups most similar to Thais are Filipino (9.1%, a difference of 1.3%), Immigrants from Taiwan (9.1%, a difference of 1.3%), Immigrants from Hong Kong (9.4%, a difference of 2.1%), Immigrants from South Central Asia (9.4%, a difference of 2.2%), and Immigrants from India (9.0%, a difference of 2.2%).
| Demographics | Rating | Rank | Male Disability |
| Immigrants | India | 100.0 /100 | #1 | Exceptional 9.0% |
| Immigrants | Taiwan | 100.0 /100 | #2 | Exceptional 9.1% |
| Filipinos | 100.0 /100 | #3 | Exceptional 9.1% |
| Thais | 100.0 /100 | #4 | Exceptional 9.2% |
| Immigrants | Hong Kong | 100.0 /100 | #5 | Exceptional 9.4% |
| Immigrants | South Central Asia | 100.0 /100 | #6 | Exceptional 9.4% |
| Immigrants | Bolivia | 100.0 /100 | #7 | Exceptional 9.5% |
| Immigrants | China | 100.0 /100 | #8 | Exceptional 9.5% |
| Immigrants | Singapore | 100.0 /100 | #9 | Exceptional 9.5% |
| Immigrants | Israel | 100.0 /100 | #10 | Exceptional 9.6% |
| Immigrants | Eastern Asia | 100.0 /100 | #11 | Exceptional 9.6% |
| Bolivians | 100.0 /100 | #12 | Exceptional 9.6% |
| Iranians | 100.0 /100 | #13 | Exceptional 9.7% |
| Immigrants | Iran | 100.0 /100 | #14 | Exceptional 9.7% |
| Indians (Asian) | 100.0 /100 | #15 | Exceptional 9.7% |