Immigrants from El Salvador vs Slavic Hearing Disability
COMPARE
Immigrants from El Salvador
Slavic
Hearing Disability
Hearing Disability Comparison
Immigrants from El Salvador
Slavs
2.6%
HEARING DISABILITY
99.7/ 100
METRIC RATING
25th/ 347
METRIC RANK
3.4%
HEARING DISABILITY
0.2/ 100
METRIC RATING
254th/ 347
METRIC RANK
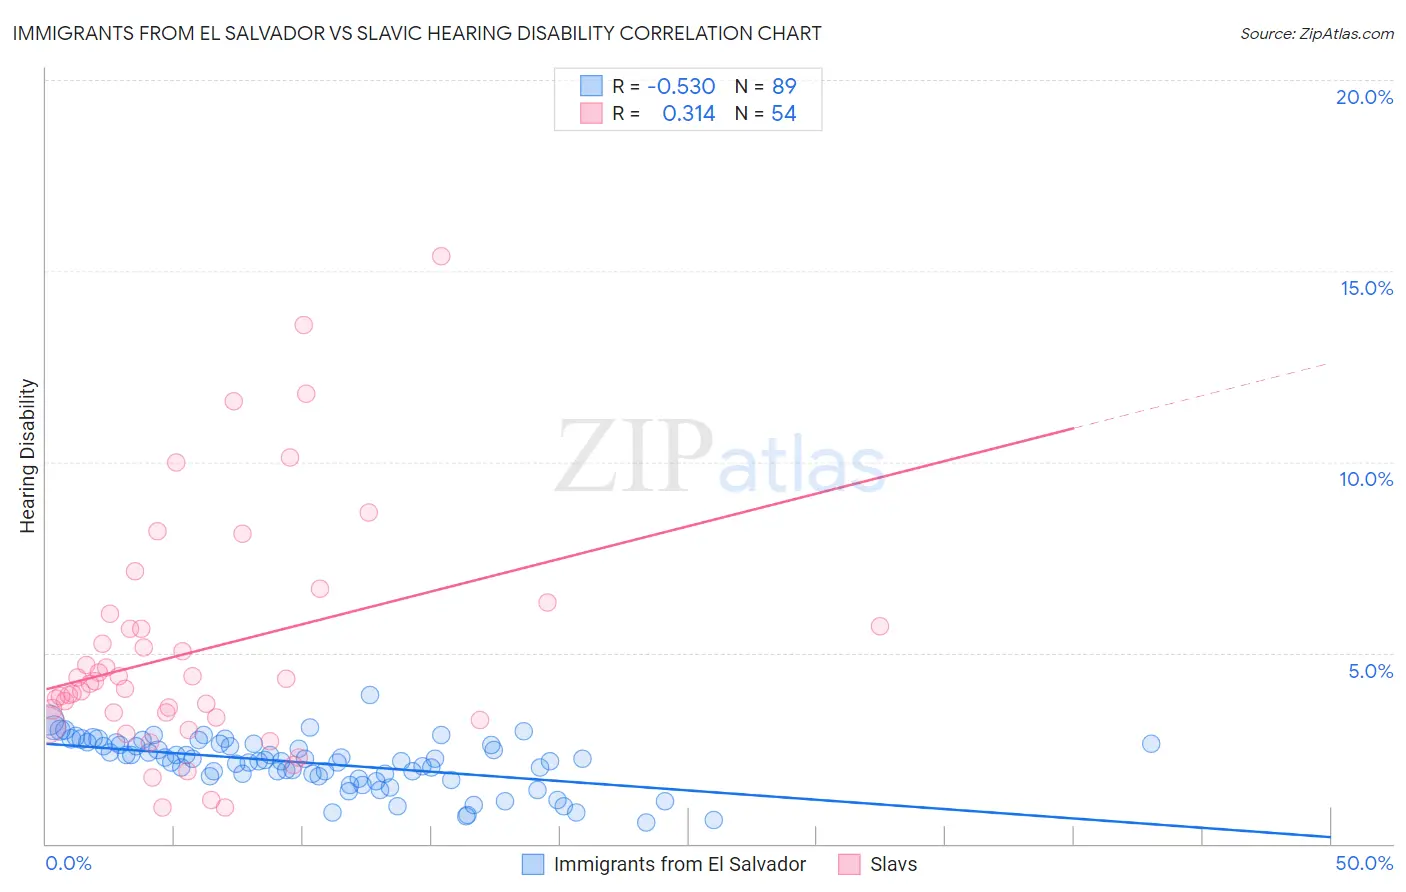
Immigrants from El Salvador vs Slavic Hearing Disability Correlation Chart
The statistical analysis conducted on geographies consisting of 357,678,057 people shows a substantial negative correlation between the proportion of Immigrants from El Salvador and percentage of population with hearing disability in the United States with a correlation coefficient (R) of -0.530 and weighted average of 2.6%. Similarly, the statistical analysis conducted on geographies consisting of 270,835,227 people shows a mild positive correlation between the proportion of Slavs and percentage of population with hearing disability in the United States with a correlation coefficient (R) of 0.314 and weighted average of 3.4%, a difference of 32.6%.
Hearing Disability Correlation Summary
| Measurement | Immigrants from El Salvador | Slavic |
| Minimum | 0.55% | 0.96% |
| Maximum | 3.9% | 15.4% |
| Range | 3.3% | 14.4% |
| Mean | 2.1% | 5.0% |
| Median | 2.2% | 4.2% |
| Interquartile 25% (IQ1) | 1.8% | 3.3% |
| Interquartile 75% (IQ3) | 2.6% | 5.7% |
| Interquartile Range (IQR) | 0.86% | 2.4% |
| Standard Deviation (Sample) | 0.67% | 3.1% |
| Standard Deviation (Population) | 0.66% | 3.1% |
Similar Demographics by Hearing Disability
Demographics Similar to Immigrants from El Salvador by Hearing Disability
In terms of hearing disability, the demographic groups most similar to Immigrants from El Salvador are Immigrants from Senegal (2.6%, a difference of 0.010%), Immigrants from South Central Asia (2.6%, a difference of 0.050%), Immigrants from Ghana (2.6%, a difference of 0.40%), Immigrants from Haiti (2.6%, a difference of 0.42%), and Bolivian (2.6%, a difference of 0.45%).
| Demographics | Rating | Rank | Hearing Disability |
| Dominicans | 99.8 /100 | #18 | Exceptional 2.5% |
| Thais | 99.8 /100 | #19 | Exceptional 2.5% |
| Immigrants | Bolivia | 99.8 /100 | #20 | Exceptional 2.5% |
| Ghanaians | 99.8 /100 | #21 | Exceptional 2.5% |
| Immigrants | Sierra Leone | 99.8 /100 | #22 | Exceptional 2.6% |
| Immigrants | Nigeria | 99.8 /100 | #23 | Exceptional 2.6% |
| Immigrants | Ghana | 99.8 /100 | #24 | Exceptional 2.6% |
| Immigrants | El Salvador | 99.7 /100 | #25 | Exceptional 2.6% |
| Immigrants | Senegal | 99.7 /100 | #26 | Exceptional 2.6% |
| Immigrants | South Central Asia | 99.7 /100 | #27 | Exceptional 2.6% |
| Immigrants | Haiti | 99.7 /100 | #28 | Exceptional 2.6% |
| Bolivians | 99.7 /100 | #29 | Exceptional 2.6% |
| Immigrants | Caribbean | 99.7 /100 | #30 | Exceptional 2.6% |
| Immigrants | Cameroon | 99.7 /100 | #31 | Exceptional 2.6% |
| Immigrants | Venezuela | 99.7 /100 | #32 | Exceptional 2.6% |
Demographics Similar to Slavs by Hearing Disability
In terms of hearing disability, the demographic groups most similar to Slavs are Polish (3.4%, a difference of 0.23%), Hmong (3.4%, a difference of 0.27%), Carpatho Rusyn (3.4%, a difference of 0.42%), Yaqui (3.4%, a difference of 0.73%), and Northern European (3.4%, a difference of 0.79%).
| Demographics | Rating | Rank | Hearing Disability |
| Lithuanians | 0.6 /100 | #247 | Tragic 3.4% |
| Austrians | 0.6 /100 | #248 | Tragic 3.4% |
| Italians | 0.4 /100 | #249 | Tragic 3.4% |
| Yuman | 0.4 /100 | #250 | Tragic 3.4% |
| Hungarians | 0.4 /100 | #251 | Tragic 3.4% |
| Croatians | 0.4 /100 | #252 | Tragic 3.4% |
| Carpatho Rusyns | 0.3 /100 | #253 | Tragic 3.4% |
| Slavs | 0.2 /100 | #254 | Tragic 3.4% |
| Poles | 0.2 /100 | #255 | Tragic 3.4% |
| Hmong | 0.2 /100 | #256 | Tragic 3.4% |
| Yaqui | 0.2 /100 | #257 | Tragic 3.4% |
| Northern Europeans | 0.2 /100 | #258 | Tragic 3.4% |
| Slovenes | 0.1 /100 | #259 | Tragic 3.5% |
| Portuguese | 0.1 /100 | #260 | Tragic 3.5% |
| Hawaiians | 0.1 /100 | #261 | Tragic 3.5% |