Moroccan vs Slavic Hearing Disability
COMPARE
Moroccan
Slavic
Hearing Disability
Hearing Disability Comparison
Moroccans
Slavs
2.8%
HEARING DISABILITY
93.9/ 100
METRIC RATING
105th/ 347
METRIC RANK
3.4%
HEARING DISABILITY
0.2/ 100
METRIC RATING
254th/ 347
METRIC RANK
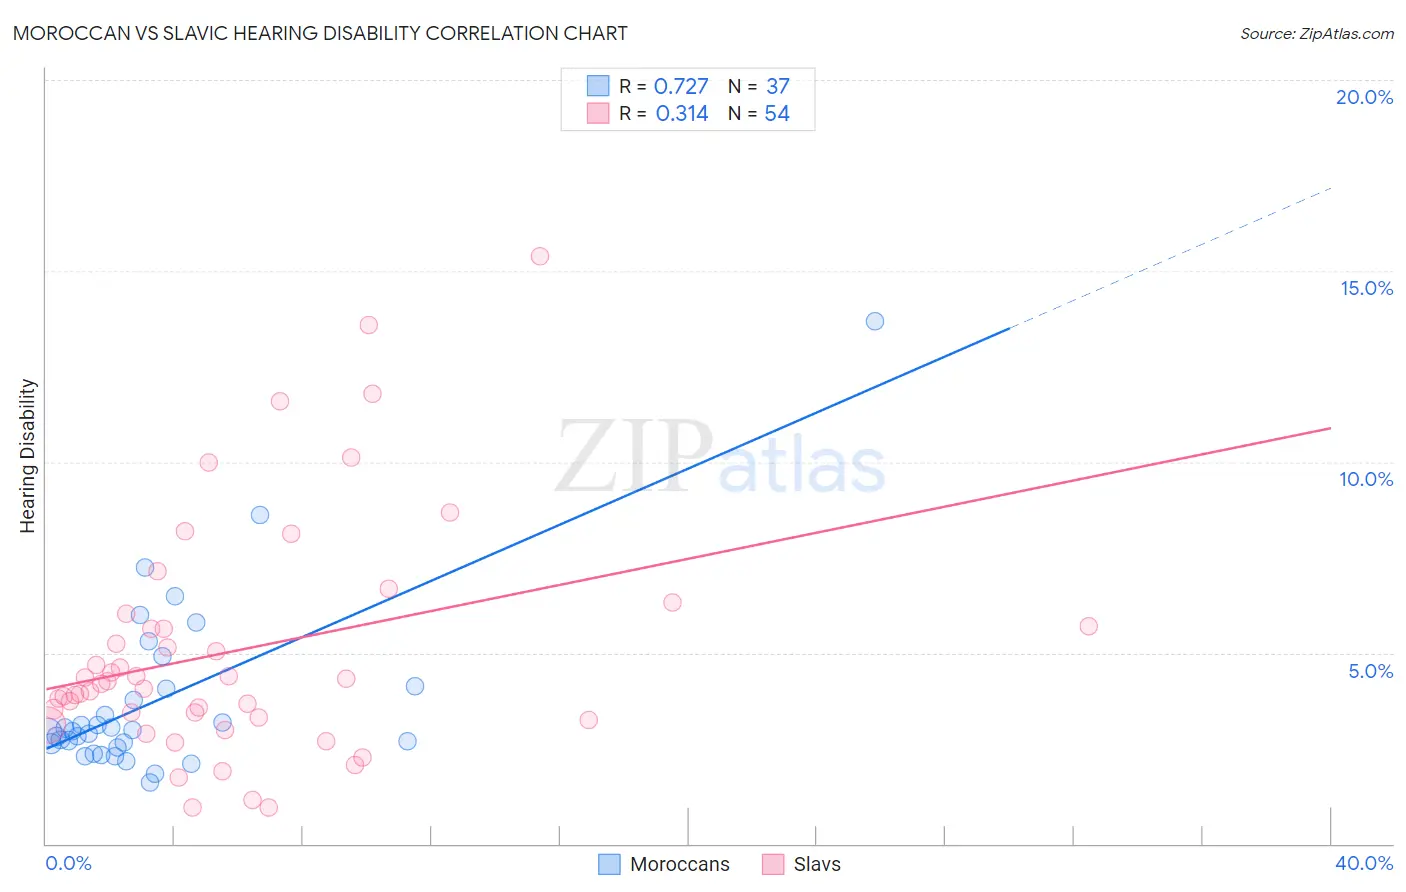
Moroccan vs Slavic Hearing Disability Correlation Chart
The statistical analysis conducted on geographies consisting of 201,794,286 people shows a strong positive correlation between the proportion of Moroccans and percentage of population with hearing disability in the United States with a correlation coefficient (R) of 0.727 and weighted average of 2.8%. Similarly, the statistical analysis conducted on geographies consisting of 270,835,227 people shows a mild positive correlation between the proportion of Slavs and percentage of population with hearing disability in the United States with a correlation coefficient (R) of 0.314 and weighted average of 3.4%, a difference of 22.1%.
Hearing Disability Correlation Summary
| Measurement | Moroccan | Slavic |
| Minimum | 1.6% | 0.96% |
| Maximum | 13.7% | 15.4% |
| Range | 12.1% | 14.4% |
| Mean | 3.8% | 5.0% |
| Median | 3.0% | 4.2% |
| Interquartile 25% (IQ1) | 2.6% | 3.3% |
| Interquartile 75% (IQ3) | 4.1% | 5.7% |
| Interquartile Range (IQR) | 1.5% | 2.4% |
| Standard Deviation (Sample) | 2.3% | 3.1% |
| Standard Deviation (Population) | 2.3% | 3.1% |
Similar Demographics by Hearing Disability
Demographics Similar to Moroccans by Hearing Disability
In terms of hearing disability, the demographic groups most similar to Moroccans are Burmese (2.8%, a difference of 0.11%), Honduran (2.8%, a difference of 0.24%), Immigrants from Chile (2.8%, a difference of 0.24%), Guatemalan (2.8%, a difference of 0.32%), and Immigrants from Indonesia (2.8%, a difference of 0.38%).
| Demographics | Rating | Rank | Hearing Disability |
| Immigrants | Honduras | 95.1 /100 | #98 | Exceptional 2.8% |
| Immigrants | Guatemala | 95.1 /100 | #99 | Exceptional 2.8% |
| Immigrants | Eastern Africa | 95.0 /100 | #100 | Exceptional 2.8% |
| Immigrants | Spain | 94.9 /100 | #101 | Exceptional 2.8% |
| Taiwanese | 94.8 /100 | #102 | Exceptional 2.8% |
| Immigrants | Indonesia | 94.7 /100 | #103 | Exceptional 2.8% |
| Burmese | 94.2 /100 | #104 | Exceptional 2.8% |
| Moroccans | 93.9 /100 | #105 | Exceptional 2.8% |
| Hondurans | 93.4 /100 | #106 | Exceptional 2.8% |
| Immigrants | Chile | 93.4 /100 | #107 | Exceptional 2.8% |
| Guatemalans | 93.2 /100 | #108 | Exceptional 2.8% |
| Turks | 93.0 /100 | #109 | Exceptional 2.8% |
| Cypriots | 92.9 /100 | #110 | Exceptional 2.8% |
| Immigrants | Yemen | 92.7 /100 | #111 | Exceptional 2.8% |
| U.S. Virgin Islanders | 92.5 /100 | #112 | Exceptional 2.8% |
Demographics Similar to Slavs by Hearing Disability
In terms of hearing disability, the demographic groups most similar to Slavs are Polish (3.4%, a difference of 0.23%), Hmong (3.4%, a difference of 0.27%), Carpatho Rusyn (3.4%, a difference of 0.42%), Yaqui (3.4%, a difference of 0.73%), and Northern European (3.4%, a difference of 0.79%).
| Demographics | Rating | Rank | Hearing Disability |
| Lithuanians | 0.6 /100 | #247 | Tragic 3.4% |
| Austrians | 0.6 /100 | #248 | Tragic 3.4% |
| Italians | 0.4 /100 | #249 | Tragic 3.4% |
| Yuman | 0.4 /100 | #250 | Tragic 3.4% |
| Hungarians | 0.4 /100 | #251 | Tragic 3.4% |
| Croatians | 0.4 /100 | #252 | Tragic 3.4% |
| Carpatho Rusyns | 0.3 /100 | #253 | Tragic 3.4% |
| Slavs | 0.2 /100 | #254 | Tragic 3.4% |
| Poles | 0.2 /100 | #255 | Tragic 3.4% |
| Hmong | 0.2 /100 | #256 | Tragic 3.4% |
| Yaqui | 0.2 /100 | #257 | Tragic 3.4% |
| Northern Europeans | 0.2 /100 | #258 | Tragic 3.4% |
| Slovenes | 0.1 /100 | #259 | Tragic 3.5% |
| Portuguese | 0.1 /100 | #260 | Tragic 3.5% |
| Hawaiians | 0.1 /100 | #261 | Tragic 3.5% |