Immigrants from Northern Africa vs Immigrants from Serbia Vision Disability
COMPARE
Immigrants from Northern Africa
Immigrants from Serbia
Vision Disability
Vision Disability Comparison
Immigrants from Northern Africa
Immigrants from Serbia
2.0%
VISION DISABILITY
98.8/ 100
METRIC RATING
67th/ 347
METRIC RANK
2.0%
VISION DISABILITY
99.4/ 100
METRIC RATING
52nd/ 347
METRIC RANK
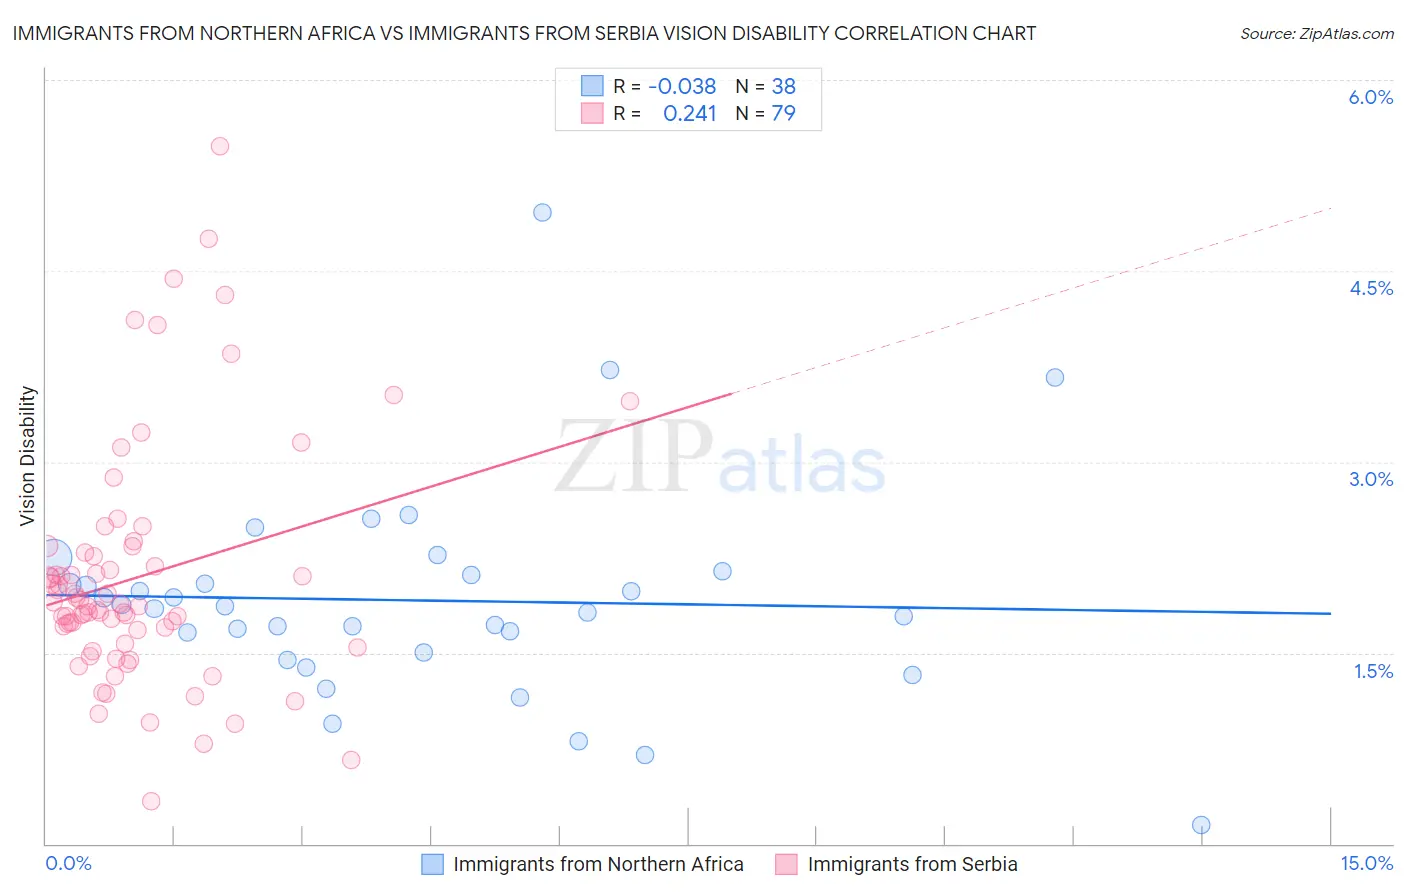
Immigrants from Northern Africa vs Immigrants from Serbia Vision Disability Correlation Chart
The statistical analysis conducted on geographies consisting of 321,057,261 people shows no correlation between the proportion of Immigrants from Northern Africa and percentage of population with vision disability in the United States with a correlation coefficient (R) of -0.038 and weighted average of 2.0%. Similarly, the statistical analysis conducted on geographies consisting of 131,728,789 people shows a weak positive correlation between the proportion of Immigrants from Serbia and percentage of population with vision disability in the United States with a correlation coefficient (R) of 0.241 and weighted average of 2.0%, a difference of 1.2%.
Vision Disability Correlation Summary
| Measurement | Immigrants from Northern Africa | Immigrants from Serbia |
| Minimum | 0.14% | 0.34% |
| Maximum | 5.0% | 5.5% |
| Range | 4.8% | 5.1% |
| Mean | 1.9% | 2.1% |
| Median | 1.9% | 1.9% |
| Interquartile 25% (IQ1) | 1.5% | 1.6% |
| Interquartile 75% (IQ3) | 2.1% | 2.3% |
| Interquartile Range (IQR) | 0.61% | 0.72% |
| Standard Deviation (Sample) | 0.84% | 0.94% |
| Standard Deviation (Population) | 0.83% | 0.94% |
Demographics Similar to Immigrants from Northern Africa and Immigrants from Serbia by Vision Disability
In terms of vision disability, the demographic groups most similar to Immigrants from Northern Africa are Immigrants from Czechoslovakia (2.0%, a difference of 0.10%), Immigrants from Argentina (2.0%, a difference of 0.11%), Maltese (2.0%, a difference of 0.17%), Immigrants from Greece (2.0%, a difference of 0.24%), and Russian (2.0%, a difference of 0.27%). Similarly, the demographic groups most similar to Immigrants from Serbia are Immigrants from Belarus (2.0%, a difference of 0.11%), Macedonian (2.0%, a difference of 0.15%), Laotian (2.0%, a difference of 0.21%), Tongan (2.0%, a difference of 0.31%), and Jordanian (2.0%, a difference of 0.37%).
| Demographics | Rating | Rank | Vision Disability |
| Latvians | 99.5 /100 | #49 | Exceptional 2.0% |
| Afghans | 99.5 /100 | #50 | Exceptional 2.0% |
| Tongans | 99.5 /100 | #51 | Exceptional 2.0% |
| Immigrants | Serbia | 99.4 /100 | #52 | Exceptional 2.0% |
| Immigrants | Belarus | 99.3 /100 | #53 | Exceptional 2.0% |
| Macedonians | 99.3 /100 | #54 | Exceptional 2.0% |
| Laotians | 99.3 /100 | #55 | Exceptional 2.0% |
| Jordanians | 99.2 /100 | #56 | Exceptional 2.0% |
| Somalis | 99.2 /100 | #57 | Exceptional 2.0% |
| Immigrants | Saudi Arabia | 99.2 /100 | #58 | Exceptional 2.0% |
| Argentineans | 99.1 /100 | #59 | Exceptional 2.0% |
| Immigrants | Romania | 99.1 /100 | #60 | Exceptional 2.0% |
| Immigrants | Belgium | 99.1 /100 | #61 | Exceptional 2.0% |
| Immigrants | Russia | 99.1 /100 | #62 | Exceptional 2.0% |
| Armenians | 99.0 /100 | #63 | Exceptional 2.0% |
| Immigrants | Greece | 99.0 /100 | #64 | Exceptional 2.0% |
| Maltese | 98.9 /100 | #65 | Exceptional 2.0% |
| Immigrants | Argentina | 98.9 /100 | #66 | Exceptional 2.0% |
| Immigrants | Northern Africa | 98.8 /100 | #67 | Exceptional 2.0% |
| Immigrants | Czechoslovakia | 98.7 /100 | #68 | Exceptional 2.0% |
| Russians | 98.6 /100 | #69 | Exceptional 2.0% |