Immigrants from Northern Africa vs Immigrants from Serbia Child Poverty Under the Age of 5
COMPARE
Immigrants from Northern Africa
Immigrants from Serbia
Child Poverty Under the Age of 5
Child Poverty Under the Age of 5 Comparison
Immigrants from Northern Africa
Immigrants from Serbia
16.4%
CHILD POVERTY UNDER THE AGE OF 5
87.5/ 100
METRIC RATING
136th/ 347
METRIC RANK
14.9%
CHILD POVERTY UNDER THE AGE OF 5
99.5/ 100
METRIC RATING
52nd/ 347
METRIC RANK
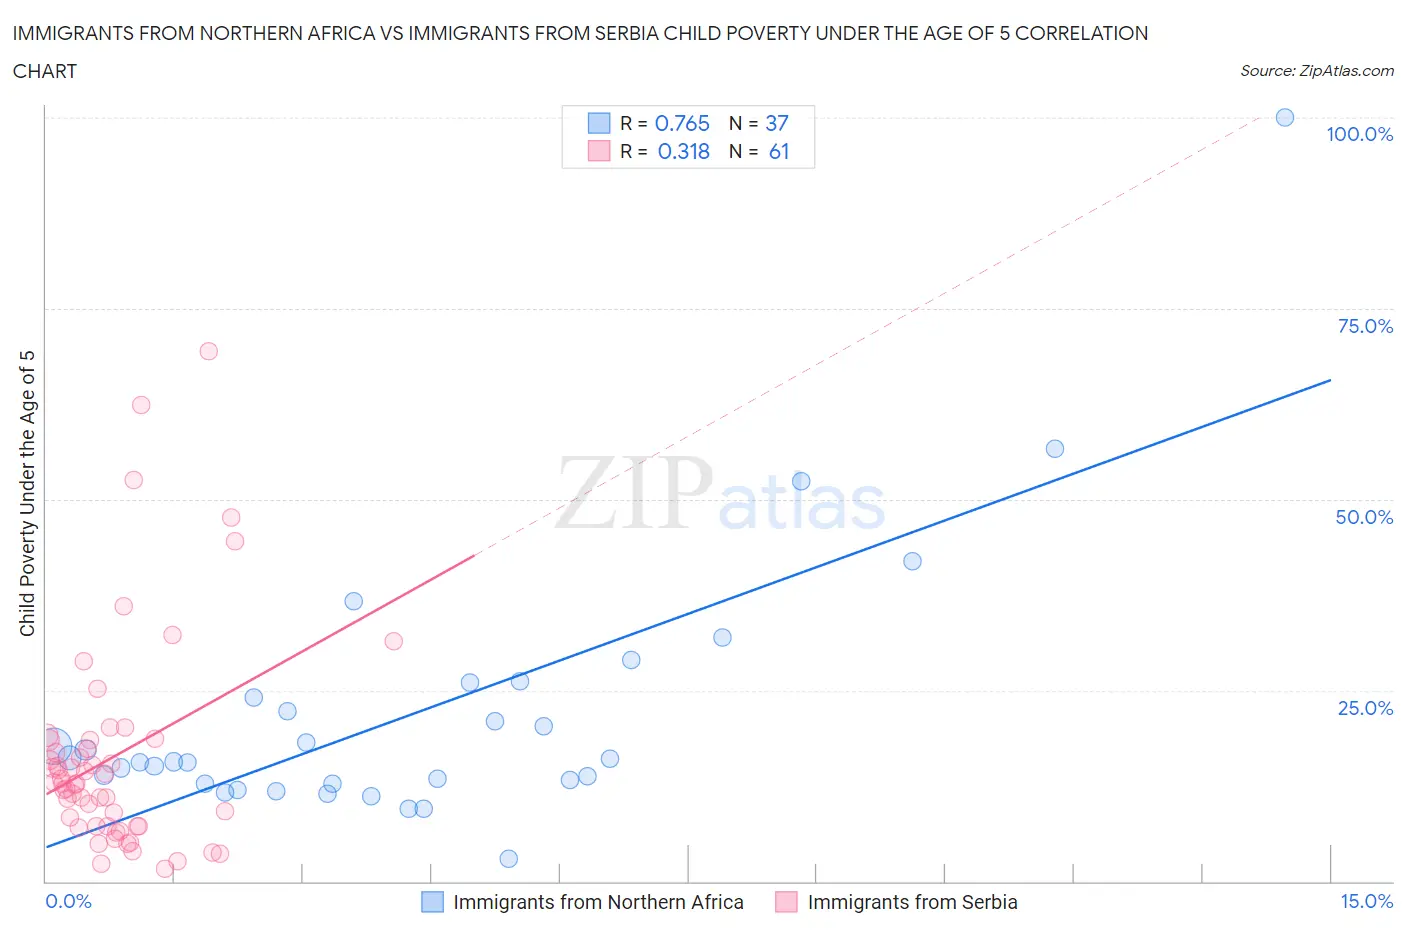
Immigrants from Northern Africa vs Immigrants from Serbia Child Poverty Under the Age of 5 Correlation Chart
The statistical analysis conducted on geographies consisting of 310,197,914 people shows a strong positive correlation between the proportion of Immigrants from Northern Africa and poverty level among children under the age of 5 in the United States with a correlation coefficient (R) of 0.765 and weighted average of 16.4%. Similarly, the statistical analysis conducted on geographies consisting of 128,825,447 people shows a mild positive correlation between the proportion of Immigrants from Serbia and poverty level among children under the age of 5 in the United States with a correlation coefficient (R) of 0.318 and weighted average of 14.9%, a difference of 9.9%.
Child Poverty Under the Age of 5 Correlation Summary
| Measurement | Immigrants from Northern Africa | Immigrants from Serbia |
| Minimum | 2.9% | 1.6% |
| Maximum | 100.0% | 69.4% |
| Range | 97.1% | 67.8% |
| Mean | 21.9% | 16.3% |
| Median | 15.6% | 12.7% |
| Interquartile 25% (IQ1) | 12.8% | 7.2% |
| Interquartile 75% (IQ3) | 25.0% | 18.5% |
| Interquartile Range (IQR) | 12.2% | 11.3% |
| Standard Deviation (Sample) | 17.5% | 14.0% |
| Standard Deviation (Population) | 17.3% | 13.9% |
Similar Demographics by Child Poverty Under the Age of 5
Demographics Similar to Immigrants from Northern Africa by Child Poverty Under the Age of 5
In terms of child poverty under the age of 5, the demographic groups most similar to Immigrants from Northern Africa are Brazilian (16.4%, a difference of 0.060%), Immigrants from North Macedonia (16.4%, a difference of 0.070%), Icelander (16.3%, a difference of 0.090%), Serbian (16.3%, a difference of 0.16%), and Finnish (16.3%, a difference of 0.19%).
| Demographics | Rating | Rank | Child Poverty Under the Age of 5 |
| British | 89.4 /100 | #129 | Excellent 16.3% |
| Immigrants | Norway | 89.3 /100 | #130 | Excellent 16.3% |
| Finns | 88.3 /100 | #131 | Excellent 16.3% |
| Serbians | 88.2 /100 | #132 | Excellent 16.3% |
| Icelanders | 87.9 /100 | #133 | Excellent 16.3% |
| Immigrants | North Macedonia | 87.8 /100 | #134 | Excellent 16.4% |
| Brazilians | 87.8 /100 | #135 | Excellent 16.4% |
| Immigrants | Northern Africa | 87.5 /100 | #136 | Excellent 16.4% |
| Immigrants | Chile | 85.3 /100 | #137 | Excellent 16.4% |
| Germans | 84.8 /100 | #138 | Excellent 16.5% |
| Immigrants | Hungary | 84.5 /100 | #139 | Excellent 16.5% |
| Guamanians/Chamorros | 84.2 /100 | #140 | Excellent 16.5% |
| Immigrants | Western Europe | 83.3 /100 | #141 | Excellent 16.5% |
| Portuguese | 83.0 /100 | #142 | Excellent 16.5% |
| Samoans | 83.0 /100 | #143 | Excellent 16.5% |
Demographics Similar to Immigrants from Serbia by Child Poverty Under the Age of 5
In terms of child poverty under the age of 5, the demographic groups most similar to Immigrants from Serbia are Luxembourger (14.9%, a difference of 0.17%), Immigrants from Israel (14.9%, a difference of 0.17%), Danish (14.9%, a difference of 0.23%), Immigrants from Pakistan (14.9%, a difference of 0.31%), and Egyptian (14.9%, a difference of 0.38%).
| Demographics | Rating | Rank | Child Poverty Under the Age of 5 |
| Laotians | 99.6 /100 | #45 | Exceptional 14.7% |
| Tsimshian | 99.6 /100 | #46 | Exceptional 14.7% |
| Russians | 99.6 /100 | #47 | Exceptional 14.8% |
| Immigrants | Czechoslovakia | 99.6 /100 | #48 | Exceptional 14.8% |
| Immigrants | Bulgaria | 99.6 /100 | #49 | Exceptional 14.8% |
| Immigrants | Northern Europe | 99.6 /100 | #50 | Exceptional 14.8% |
| Estonians | 99.6 /100 | #51 | Exceptional 14.8% |
| Immigrants | Serbia | 99.5 /100 | #52 | Exceptional 14.9% |
| Luxembourgers | 99.4 /100 | #53 | Exceptional 14.9% |
| Immigrants | Israel | 99.4 /100 | #54 | Exceptional 14.9% |
| Danes | 99.4 /100 | #55 | Exceptional 14.9% |
| Immigrants | Pakistan | 99.4 /100 | #56 | Exceptional 14.9% |
| Egyptians | 99.4 /100 | #57 | Exceptional 14.9% |
| Swedes | 99.4 /100 | #58 | Exceptional 15.0% |
| Paraguayans | 99.4 /100 | #59 | Exceptional 15.0% |