Immigrants from Northern Africa vs Immigrants from Serbia Householder Income Over 65 years
COMPARE
Immigrants from Northern Africa
Immigrants from Serbia
Householder Income Over 65 years
Householder Income Over 65 years Comparison
Immigrants from Northern Africa
Immigrants from Serbia
$62,522
HOUSEHOLDER INCOME OVER 65 YEARS
83.6/ 100
METRIC RATING
133rd/ 347
METRIC RANK
$63,387
HOUSEHOLDER INCOME OVER 65 YEARS
92.7/ 100
METRIC RATING
113th/ 347
METRIC RANK
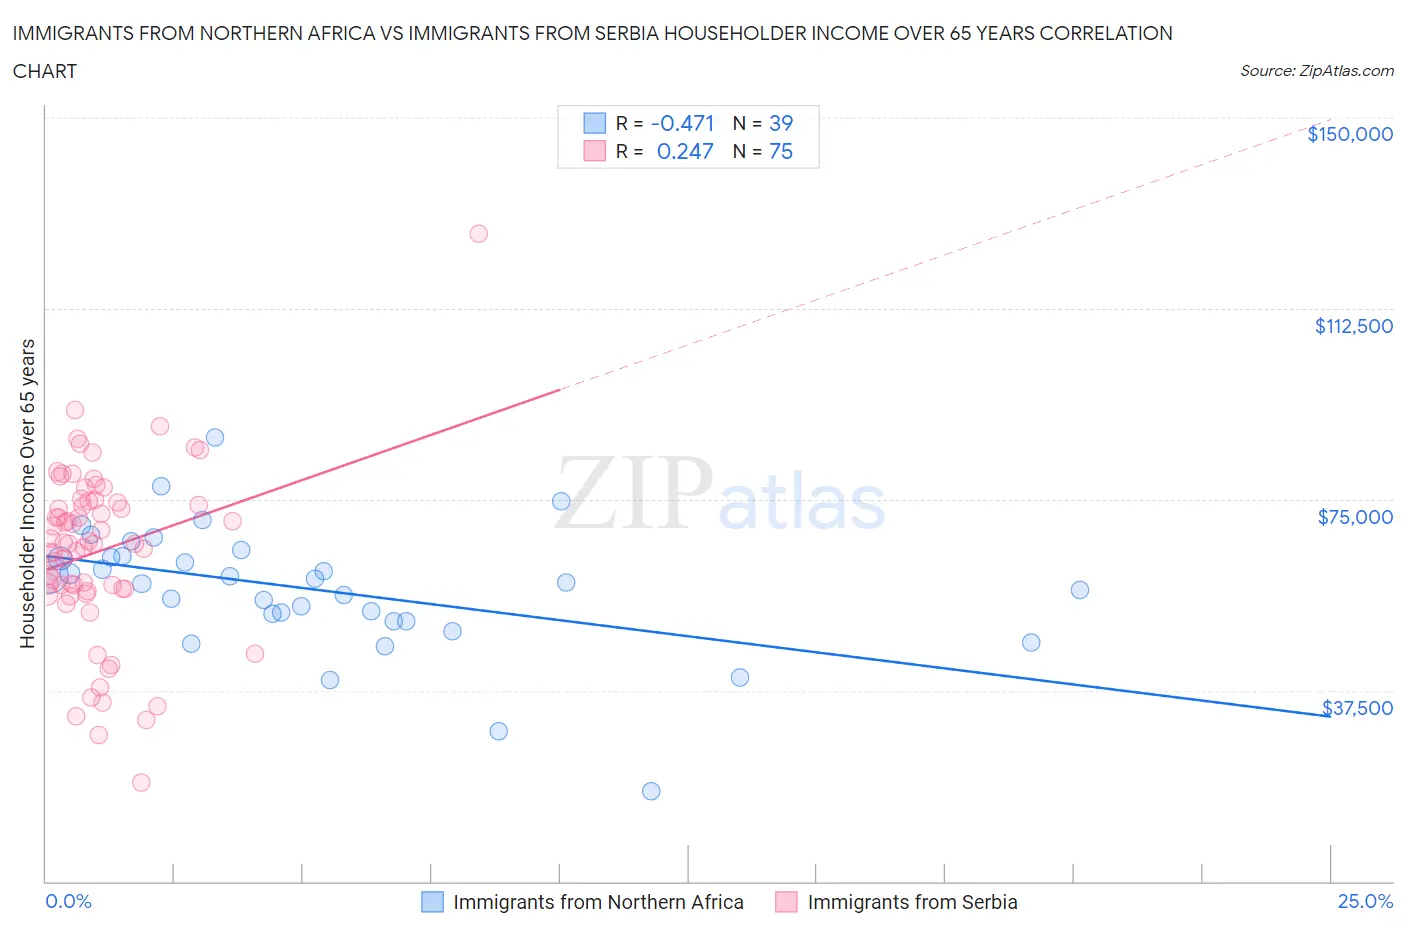
Immigrants from Northern Africa vs Immigrants from Serbia Householder Income Over 65 years Correlation Chart
The statistical analysis conducted on geographies consisting of 320,603,488 people shows a moderate negative correlation between the proportion of Immigrants from Northern Africa and household income with householder over the age of 65 in the United States with a correlation coefficient (R) of -0.471 and weighted average of $62,522. Similarly, the statistical analysis conducted on geographies consisting of 131,644,456 people shows a weak positive correlation between the proportion of Immigrants from Serbia and household income with householder over the age of 65 in the United States with a correlation coefficient (R) of 0.247 and weighted average of $63,387, a difference of 1.4%.
Householder Income Over 65 years Correlation Summary
| Measurement | Immigrants from Northern Africa | Immigrants from Serbia |
| Minimum | $17,788 | $19,307 |
| Maximum | $87,122 | $127,250 |
| Range | $69,334 | $107,943 |
| Mean | $57,290 | $64,869 |
| Median | $58,750 | $66,375 |
| Interquartile 25% (IQ1) | $51,125 | $57,419 |
| Interquartile 75% (IQ3) | $63,952 | $74,688 |
| Interquartile Range (IQR) | $12,827 | $17,269 |
| Standard Deviation (Sample) | $12,617 | $17,146 |
| Standard Deviation (Population) | $12,454 | $17,032 |
Demographics Similar to Immigrants from Northern Africa and Immigrants from Serbia by Householder Income Over 65 years
In terms of householder income over 65 years, the demographic groups most similar to Immigrants from Northern Africa are Immigrants from Germany ($62,544, a difference of 0.040%), Immigrants from Western Asia ($62,645, a difference of 0.20%), Basque ($62,653, a difference of 0.21%), Immigrants from Eastern Europe ($62,693, a difference of 0.27%), and Aleut ($62,708, a difference of 0.30%). Similarly, the demographic groups most similar to Immigrants from Serbia are Immigrants from Saudi Arabia ($63,355, a difference of 0.050%), Croatian ($63,225, a difference of 0.26%), Guamanian/Chamorro ($63,187, a difference of 0.32%), Immigrants from Croatia ($63,168, a difference of 0.35%), and Danish ($63,117, a difference of 0.43%).
| Demographics | Rating | Rank | Householder Income Over 65 years |
| Immigrants | Serbia | 92.7 /100 | #113 | Exceptional $63,387 |
| Immigrants | Saudi Arabia | 92.4 /100 | #114 | Exceptional $63,355 |
| Croatians | 91.4 /100 | #115 | Exceptional $63,225 |
| Guamanians/Chamorros | 91.1 /100 | #116 | Exceptional $63,187 |
| Immigrants | Croatia | 90.9 /100 | #117 | Exceptional $63,168 |
| Danes | 90.5 /100 | #118 | Exceptional $63,117 |
| Immigrants | Jordan | 89.8 /100 | #119 | Excellent $63,041 |
| Ukrainians | 89.7 /100 | #120 | Excellent $63,032 |
| Immigrants | Vietnam | 89.5 /100 | #121 | Excellent $63,014 |
| Immigrants | Moldova | 88.7 /100 | #122 | Excellent $62,939 |
| Tlingit-Haida | 88.6 /100 | #123 | Excellent $62,922 |
| Taiwanese | 88.3 /100 | #124 | Excellent $62,894 |
| Soviet Union | 87.8 /100 | #125 | Excellent $62,848 |
| Peruvians | 86.8 /100 | #126 | Excellent $62,766 |
| Swedes | 86.4 /100 | #127 | Excellent $62,736 |
| Aleuts | 86.1 /100 | #128 | Excellent $62,708 |
| Immigrants | Eastern Europe | 85.9 /100 | #129 | Excellent $62,693 |
| Basques | 85.4 /100 | #130 | Excellent $62,653 |
| Immigrants | Western Asia | 85.3 /100 | #131 | Excellent $62,645 |
| Immigrants | Germany | 83.9 /100 | #132 | Excellent $62,544 |
| Immigrants | Northern Africa | 83.6 /100 | #133 | Excellent $62,522 |