Immigrants from Honduras vs Okinawan Ambulatory Disability
COMPARE
Immigrants from Honduras
Okinawan
Ambulatory Disability
Ambulatory Disability Comparison
Immigrants from Honduras
Okinawans
6.3%
AMBULATORY DISABILITY
7.6/ 100
METRIC RATING
223rd/ 347
METRIC RANK
5.3%
AMBULATORY DISABILITY
100.0/ 100
METRIC RATING
12th/ 347
METRIC RANK
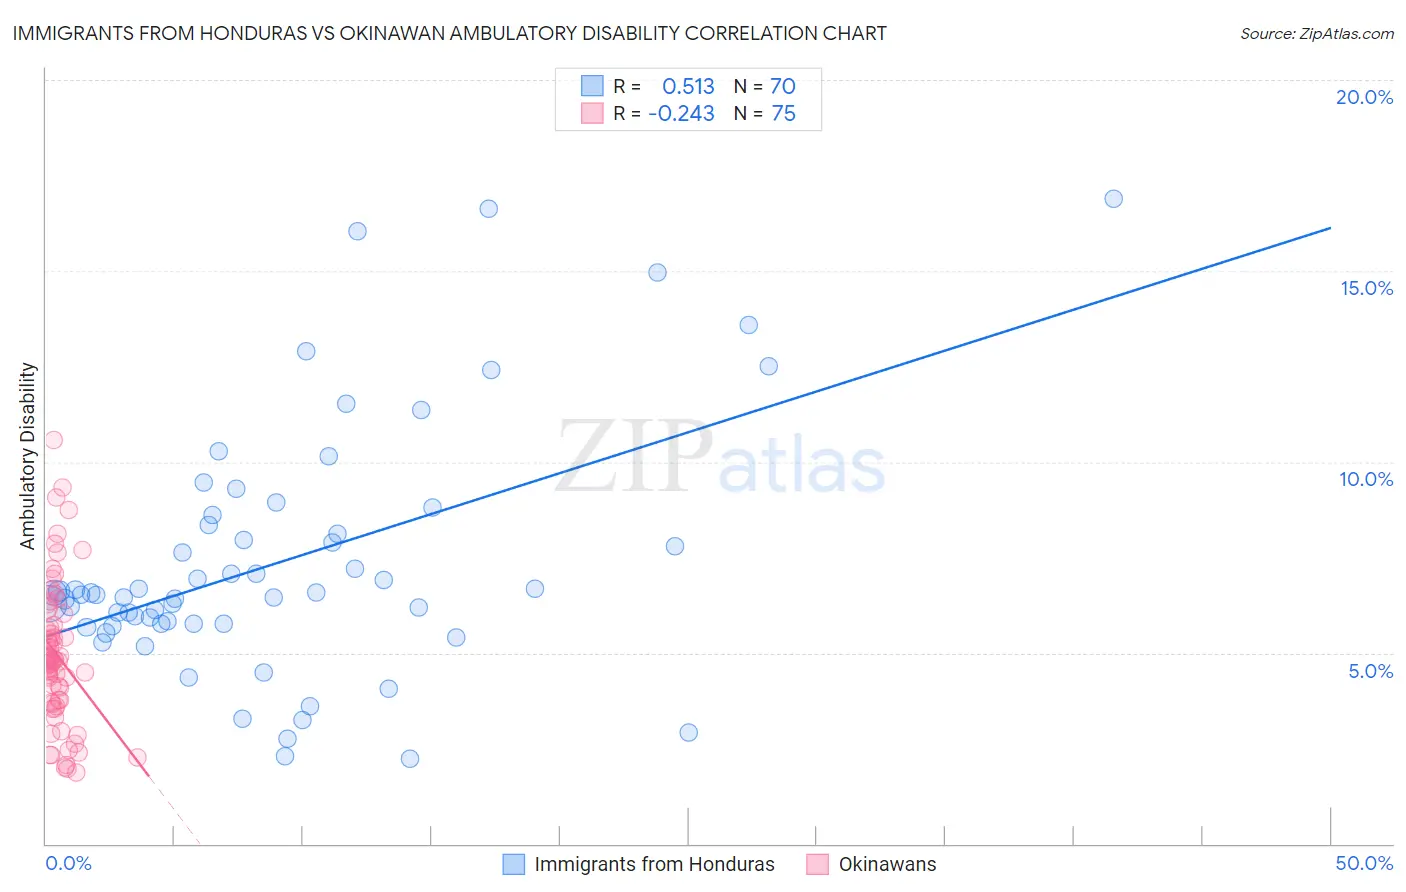
Immigrants from Honduras vs Okinawan Ambulatory Disability Correlation Chart
The statistical analysis conducted on geographies consisting of 322,545,499 people shows a substantial positive correlation between the proportion of Immigrants from Honduras and percentage of population with ambulatory disability in the United States with a correlation coefficient (R) of 0.513 and weighted average of 6.3%. Similarly, the statistical analysis conducted on geographies consisting of 73,734,691 people shows a weak negative correlation between the proportion of Okinawans and percentage of population with ambulatory disability in the United States with a correlation coefficient (R) of -0.243 and weighted average of 5.3%, a difference of 20.2%.
Ambulatory Disability Correlation Summary
| Measurement | Immigrants from Honduras | Okinawan |
| Minimum | 2.2% | 1.9% |
| Maximum | 16.9% | 10.6% |
| Range | 14.6% | 8.7% |
| Mean | 7.4% | 4.9% |
| Median | 6.5% | 4.8% |
| Interquartile 25% (IQ1) | 5.8% | 3.7% |
| Interquartile 75% (IQ3) | 8.3% | 5.7% |
| Interquartile Range (IQR) | 2.6% | 2.0% |
| Standard Deviation (Sample) | 3.2% | 1.8% |
| Standard Deviation (Population) | 3.2% | 1.8% |
Similar Demographics by Ambulatory Disability
Demographics Similar to Immigrants from Honduras by Ambulatory Disability
In terms of ambulatory disability, the demographic groups most similar to Immigrants from Honduras are Liberian (6.3%, a difference of 0.10%), Honduran (6.3%, a difference of 0.27%), German Russian (6.3%, a difference of 0.29%), Hungarian (6.3%, a difference of 0.32%), and Immigrants from Albania (6.3%, a difference of 0.33%).
| Demographics | Rating | Rank | Ambulatory Disability |
| Canadians | 10.9 /100 | #216 | Poor 6.3% |
| Yugoslavians | 10.9 /100 | #217 | Poor 6.3% |
| Guamanians/Chamorros | 10.6 /100 | #218 | Poor 6.3% |
| Indonesians | 9.9 /100 | #219 | Tragic 6.3% |
| Immigrants | Albania | 9.6 /100 | #220 | Tragic 6.3% |
| Hungarians | 9.6 /100 | #221 | Tragic 6.3% |
| German Russians | 9.4 /100 | #222 | Tragic 6.3% |
| Immigrants | Honduras | 7.6 /100 | #223 | Tragic 6.3% |
| Liberians | 7.1 /100 | #224 | Tragic 6.3% |
| Hondurans | 6.3 /100 | #225 | Tragic 6.3% |
| Slavs | 5.1 /100 | #226 | Tragic 6.4% |
| Cubans | 4.0 /100 | #227 | Tragic 6.4% |
| Portuguese | 4.0 /100 | #228 | Tragic 6.4% |
| Czechoslovakians | 3.8 /100 | #229 | Tragic 6.4% |
| Mexicans | 3.5 /100 | #230 | Tragic 6.4% |
Demographics Similar to Okinawans by Ambulatory Disability
In terms of ambulatory disability, the demographic groups most similar to Okinawans are Immigrants from Korea (5.2%, a difference of 0.31%), Burmese (5.3%, a difference of 0.50%), Immigrants from Eastern Asia (5.3%, a difference of 0.65%), Immigrants from China (5.3%, a difference of 0.98%), and Immigrants from Hong Kong (5.3%, a difference of 1.5%).
| Demographics | Rating | Rank | Ambulatory Disability |
| Immigrants | Singapore | 100.0 /100 | #5 | Exceptional 5.0% |
| Immigrants | Bolivia | 100.0 /100 | #6 | Exceptional 5.0% |
| Bolivians | 100.0 /100 | #7 | Exceptional 5.1% |
| Immigrants | South Central Asia | 100.0 /100 | #8 | Exceptional 5.1% |
| Iranians | 100.0 /100 | #9 | Exceptional 5.1% |
| Yup'ik | 100.0 /100 | #10 | Exceptional 5.2% |
| Immigrants | Korea | 100.0 /100 | #11 | Exceptional 5.2% |
| Okinawans | 100.0 /100 | #12 | Exceptional 5.3% |
| Burmese | 100.0 /100 | #13 | Exceptional 5.3% |
| Immigrants | Eastern Asia | 100.0 /100 | #14 | Exceptional 5.3% |
| Immigrants | China | 100.0 /100 | #15 | Exceptional 5.3% |
| Immigrants | Hong Kong | 100.0 /100 | #16 | Exceptional 5.3% |
| Immigrants | Ethiopia | 100.0 /100 | #17 | Exceptional 5.4% |
| Immigrants | Sri Lanka | 100.0 /100 | #18 | Exceptional 5.4% |
| Indians (Asian) | 100.0 /100 | #19 | Exceptional 5.4% |