Immigrants from North Macedonia vs Immigrants from Guatemala Self-Care Disability
COMPARE
Immigrants from North Macedonia
Immigrants from Guatemala
Self-Care Disability
Self-Care Disability Comparison
Immigrants from North Macedonia
Immigrants from Guatemala
2.4%
SELF-CARE DISABILITY
93.1/ 100
METRIC RATING
114th/ 347
METRIC RANK
2.6%
SELF-CARE DISABILITY
2.2/ 100
METRIC RATING
231st/ 347
METRIC RANK
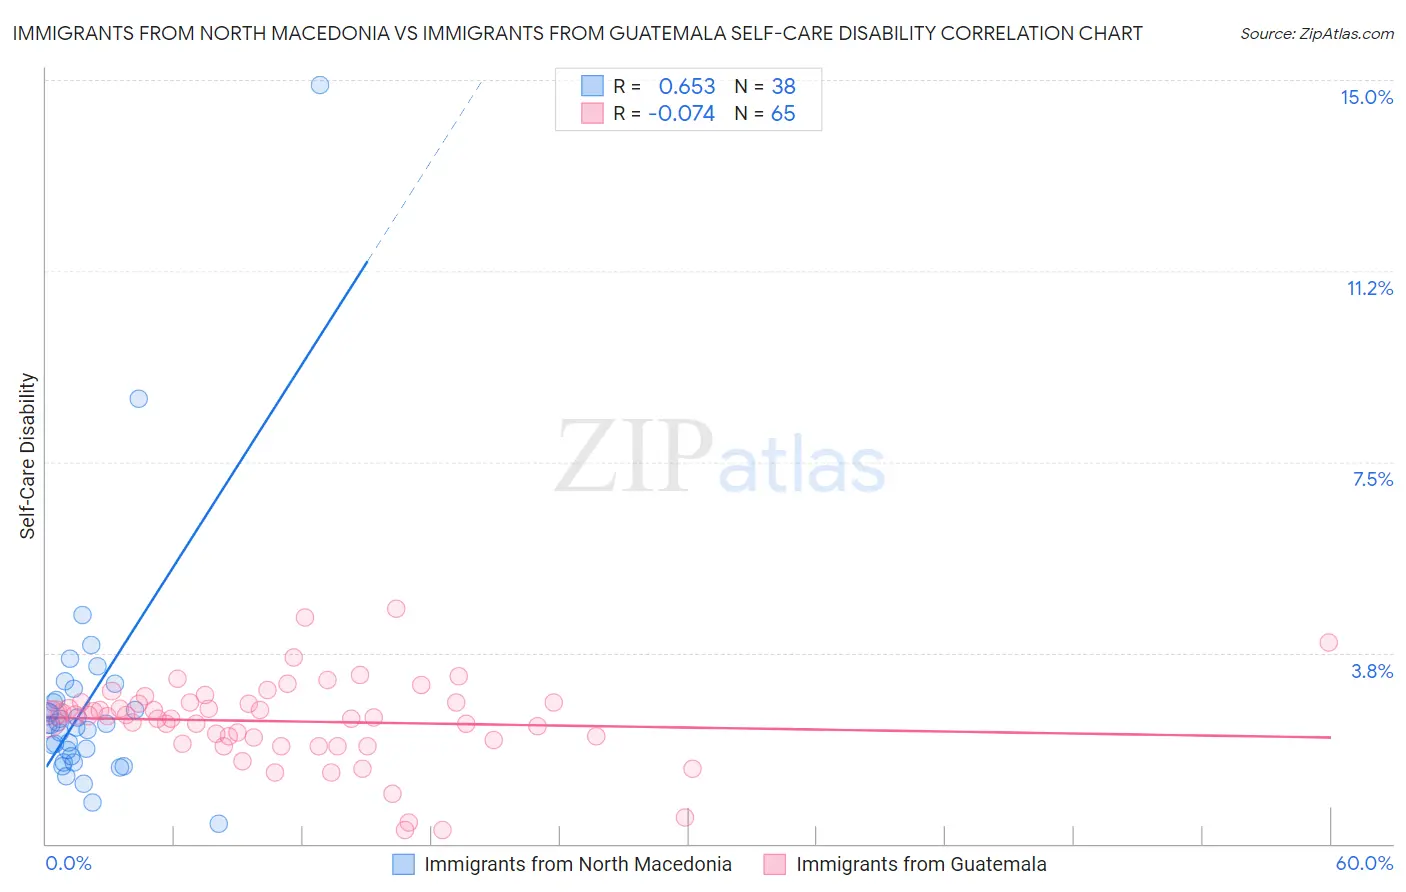
Immigrants from North Macedonia vs Immigrants from Guatemala Self-Care Disability Correlation Chart
The statistical analysis conducted on geographies consisting of 74,312,524 people shows a significant positive correlation between the proportion of Immigrants from North Macedonia and percentage of population with self-care disability in the United States with a correlation coefficient (R) of 0.653 and weighted average of 2.4%. Similarly, the statistical analysis conducted on geographies consisting of 376,972,339 people shows a slight negative correlation between the proportion of Immigrants from Guatemala and percentage of population with self-care disability in the United States with a correlation coefficient (R) of -0.074 and weighted average of 2.6%, a difference of 7.9%.
Self-Care Disability Correlation Summary
| Measurement | Immigrants from North Macedonia | Immigrants from Guatemala |
| Minimum | 0.40% | 0.26% |
| Maximum | 14.9% | 4.6% |
| Range | 14.5% | 4.3% |
| Mean | 2.8% | 2.4% |
| Median | 2.3% | 2.5% |
| Interquartile 25% (IQ1) | 1.7% | 2.0% |
| Interquartile 75% (IQ3) | 2.8% | 2.8% |
| Interquartile Range (IQR) | 1.1% | 0.77% |
| Standard Deviation (Sample) | 2.4% | 0.84% |
| Standard Deviation (Population) | 2.4% | 0.83% |
Similar Demographics by Self-Care Disability
Demographics Similar to Immigrants from North Macedonia by Self-Care Disability
In terms of self-care disability, the demographic groups most similar to Immigrants from North Macedonia are South American (2.4%, a difference of 0.0%), Immigrants from Hong Kong (2.4%, a difference of 0.0%), Northern European (2.4%, a difference of 0.050%), Scandinavian (2.4%, a difference of 0.070%), and Serbian (2.4%, a difference of 0.090%).
| Demographics | Rating | Rank | Self-Care Disability |
| British | 94.3 /100 | #107 | Exceptional 2.4% |
| Greeks | 94.1 /100 | #108 | Exceptional 2.4% |
| Slovenes | 94.1 /100 | #109 | Exceptional 2.4% |
| Immigrants | Africa | 93.7 /100 | #110 | Exceptional 2.4% |
| Serbians | 93.6 /100 | #111 | Exceptional 2.4% |
| Scandinavians | 93.5 /100 | #112 | Exceptional 2.4% |
| South Americans | 93.2 /100 | #113 | Exceptional 2.4% |
| Immigrants | North Macedonia | 93.1 /100 | #114 | Exceptional 2.4% |
| Immigrants | Hong Kong | 93.1 /100 | #115 | Exceptional 2.4% |
| Northern Europeans | 92.9 /100 | #116 | Exceptional 2.4% |
| Taiwanese | 92.5 /100 | #117 | Exceptional 2.4% |
| Immigrants | Canada | 92.0 /100 | #118 | Exceptional 2.4% |
| Immigrants | Sierra Leone | 91.8 /100 | #119 | Exceptional 2.4% |
| Uruguayans | 91.5 /100 | #120 | Exceptional 2.4% |
| Peruvians | 91.3 /100 | #121 | Exceptional 2.4% |
Demographics Similar to Immigrants from Guatemala by Self-Care Disability
In terms of self-care disability, the demographic groups most similar to Immigrants from Guatemala are Albanian (2.6%, a difference of 0.030%), Liberian (2.6%, a difference of 0.070%), Vietnamese (2.6%, a difference of 0.070%), Bahamian (2.6%, a difference of 0.11%), and Guamanian/Chamorro (2.6%, a difference of 0.15%).
| Demographics | Rating | Rank | Self-Care Disability |
| Osage | 3.6 /100 | #224 | Tragic 2.6% |
| Iraqis | 3.2 /100 | #225 | Tragic 2.6% |
| Chinese | 2.9 /100 | #226 | Tragic 2.6% |
| Immigrants | Philippines | 2.7 /100 | #227 | Tragic 2.6% |
| Guatemalans | 2.7 /100 | #228 | Tragic 2.6% |
| Guamanians/Chamorros | 2.5 /100 | #229 | Tragic 2.6% |
| Immigrants | Ecuador | 2.5 /100 | #230 | Tragic 2.6% |
| Immigrants | Guatemala | 2.2 /100 | #231 | Tragic 2.6% |
| Albanians | 2.2 /100 | #232 | Tragic 2.6% |
| Liberians | 2.1 /100 | #233 | Tragic 2.6% |
| Vietnamese | 2.1 /100 | #234 | Tragic 2.6% |
| Bahamians | 2.0 /100 | #235 | Tragic 2.6% |
| Bermudans | 1.9 /100 | #236 | Tragic 2.6% |
| Immigrants | Senegal | 1.6 /100 | #237 | Tragic 2.6% |
| Senegalese | 1.3 /100 | #238 | Tragic 2.6% |