Immigrants from Norway vs Immigrants from Guatemala Self-Care Disability
COMPARE
Immigrants from Norway
Immigrants from Guatemala
Self-Care Disability
Self-Care Disability Comparison
Immigrants from Norway
Immigrants from Guatemala
2.3%
SELF-CARE DISABILITY
99.2/ 100
METRIC RATING
69th/ 347
METRIC RANK
2.6%
SELF-CARE DISABILITY
2.2/ 100
METRIC RATING
231st/ 347
METRIC RANK
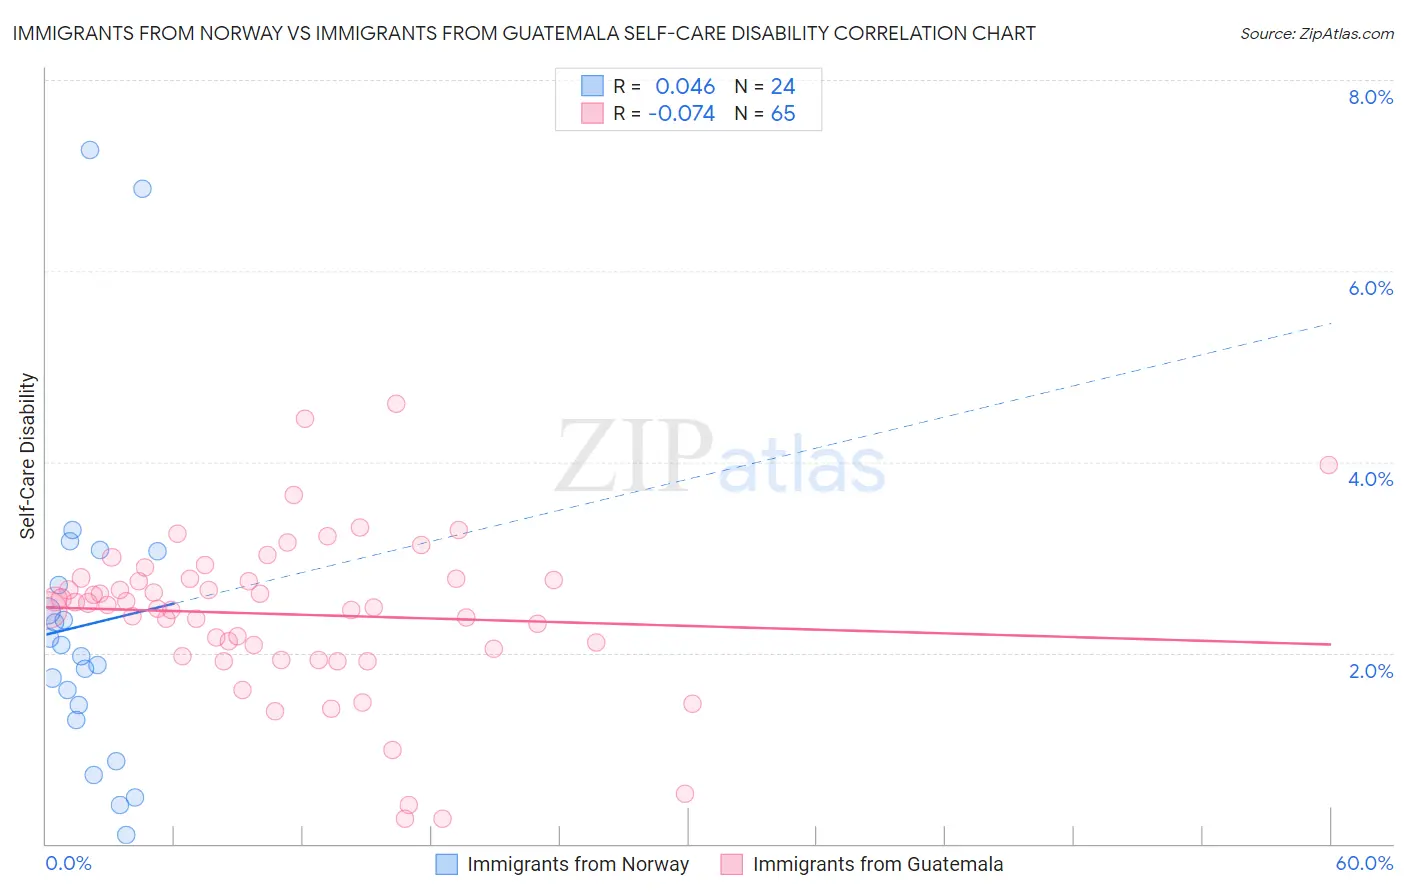
Immigrants from Norway vs Immigrants from Guatemala Self-Care Disability Correlation Chart
The statistical analysis conducted on geographies consisting of 116,682,043 people shows no correlation between the proportion of Immigrants from Norway and percentage of population with self-care disability in the United States with a correlation coefficient (R) of 0.046 and weighted average of 2.3%. Similarly, the statistical analysis conducted on geographies consisting of 376,972,339 people shows a slight negative correlation between the proportion of Immigrants from Guatemala and percentage of population with self-care disability in the United States with a correlation coefficient (R) of -0.074 and weighted average of 2.6%, a difference of 10.9%.
Self-Care Disability Correlation Summary
| Measurement | Immigrants from Norway | Immigrants from Guatemala |
| Minimum | 0.094% | 0.26% |
| Maximum | 7.3% | 4.6% |
| Range | 7.2% | 4.3% |
| Mean | 2.3% | 2.4% |
| Median | 2.0% | 2.5% |
| Interquartile 25% (IQ1) | 1.4% | 2.0% |
| Interquartile 75% (IQ3) | 2.9% | 2.8% |
| Interquartile Range (IQR) | 1.5% | 0.77% |
| Standard Deviation (Sample) | 1.7% | 0.84% |
| Standard Deviation (Population) | 1.7% | 0.83% |
Similar Demographics by Self-Care Disability
Demographics Similar to Immigrants from Norway by Self-Care Disability
In terms of self-care disability, the demographic groups most similar to Immigrants from Norway are Immigrants from Zaire (2.3%, a difference of 0.0%), Immigrants from Northern Europe (2.3%, a difference of 0.040%), Asian (2.3%, a difference of 0.070%), South African (2.3%, a difference of 0.090%), and Eastern European (2.3%, a difference of 0.10%).
| Demographics | Rating | Rank | Self-Care Disability |
| Egyptians | 99.4 /100 | #62 | Exceptional 2.3% |
| Mongolians | 99.3 /100 | #63 | Exceptional 2.3% |
| Swedes | 99.3 /100 | #64 | Exceptional 2.3% |
| Brazilians | 99.3 /100 | #65 | Exceptional 2.3% |
| Immigrants | Argentina | 99.3 /100 | #66 | Exceptional 2.3% |
| South Africans | 99.3 /100 | #67 | Exceptional 2.3% |
| Immigrants | Zaire | 99.2 /100 | #68 | Exceptional 2.3% |
| Immigrants | Norway | 99.2 /100 | #69 | Exceptional 2.3% |
| Immigrants | Northern Europe | 99.2 /100 | #70 | Exceptional 2.3% |
| Asians | 99.2 /100 | #71 | Exceptional 2.3% |
| Eastern Europeans | 99.2 /100 | #72 | Exceptional 2.3% |
| Immigrants | Egypt | 99.1 /100 | #73 | Exceptional 2.3% |
| Immigrants | Switzerland | 99.1 /100 | #74 | Exceptional 2.3% |
| Immigrants | Netherlands | 99.1 /100 | #75 | Exceptional 2.3% |
| Immigrants | China | 99.1 /100 | #76 | Exceptional 2.3% |
Demographics Similar to Immigrants from Guatemala by Self-Care Disability
In terms of self-care disability, the demographic groups most similar to Immigrants from Guatemala are Albanian (2.6%, a difference of 0.030%), Liberian (2.6%, a difference of 0.070%), Vietnamese (2.6%, a difference of 0.070%), Bahamian (2.6%, a difference of 0.11%), and Guamanian/Chamorro (2.6%, a difference of 0.15%).
| Demographics | Rating | Rank | Self-Care Disability |
| Osage | 3.6 /100 | #224 | Tragic 2.6% |
| Iraqis | 3.2 /100 | #225 | Tragic 2.6% |
| Chinese | 2.9 /100 | #226 | Tragic 2.6% |
| Immigrants | Philippines | 2.7 /100 | #227 | Tragic 2.6% |
| Guatemalans | 2.7 /100 | #228 | Tragic 2.6% |
| Guamanians/Chamorros | 2.5 /100 | #229 | Tragic 2.6% |
| Immigrants | Ecuador | 2.5 /100 | #230 | Tragic 2.6% |
| Immigrants | Guatemala | 2.2 /100 | #231 | Tragic 2.6% |
| Albanians | 2.2 /100 | #232 | Tragic 2.6% |
| Liberians | 2.1 /100 | #233 | Tragic 2.6% |
| Vietnamese | 2.1 /100 | #234 | Tragic 2.6% |
| Bahamians | 2.0 /100 | #235 | Tragic 2.6% |
| Bermudans | 1.9 /100 | #236 | Tragic 2.6% |
| Immigrants | Senegal | 1.6 /100 | #237 | Tragic 2.6% |
| Senegalese | 1.3 /100 | #238 | Tragic 2.6% |