Immigrants from North America vs Immigrants from Iraq High School Diploma
COMPARE
Immigrants from North America
Immigrants from Iraq
High School Diploma
High School Diploma Comparison
Immigrants from North America
Immigrants from Iraq
91.0%
HIGH SCHOOL DIPLOMA
99.7/ 100
METRIC RATING
59th/ 347
METRIC RANK
89.4%
HIGH SCHOOL DIPLOMA
68.7/ 100
METRIC RATING
153rd/ 347
METRIC RANK
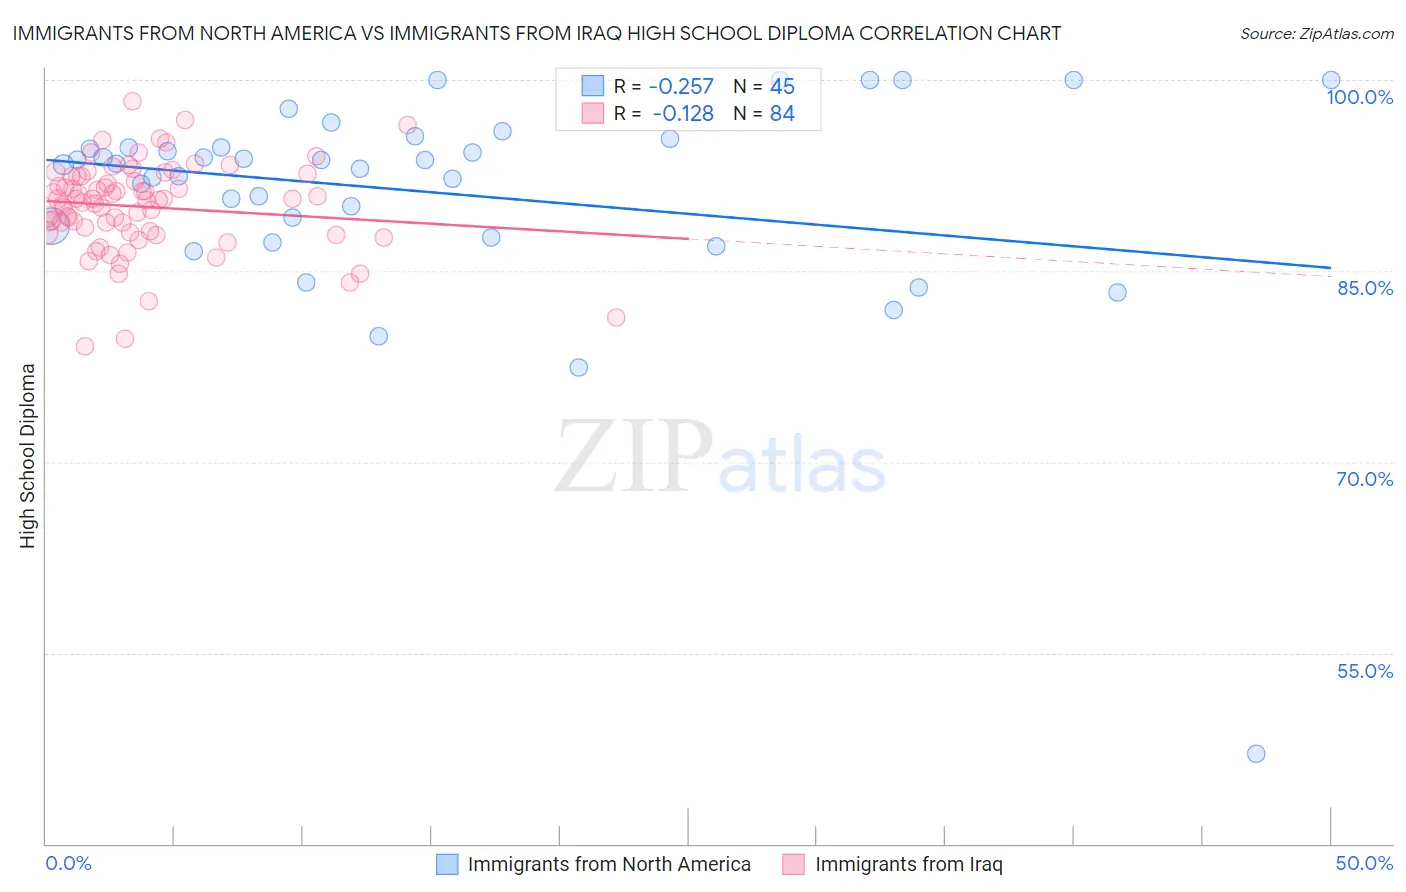
Immigrants from North America vs Immigrants from Iraq High School Diploma Correlation Chart
The statistical analysis conducted on geographies consisting of 462,461,910 people shows a weak negative correlation between the proportion of Immigrants from North America and percentage of population with at least high school diploma education in the United States with a correlation coefficient (R) of -0.257 and weighted average of 91.0%. Similarly, the statistical analysis conducted on geographies consisting of 194,726,982 people shows a poor negative correlation between the proportion of Immigrants from Iraq and percentage of population with at least high school diploma education in the United States with a correlation coefficient (R) of -0.128 and weighted average of 89.4%, a difference of 1.8%.
High School Diploma Correlation Summary
| Measurement | Immigrants from North America | Immigrants from Iraq |
| Minimum | 47.1% | 79.0% |
| Maximum | 100.0% | 98.3% |
| Range | 52.9% | 19.3% |
| Mean | 91.1% | 90.0% |
| Median | 93.4% | 90.6% |
| Interquartile 25% (IQ1) | 88.1% | 88.1% |
| Interquartile 75% (IQ3) | 95.1% | 92.4% |
| Interquartile Range (IQR) | 7.0% | 4.3% |
| Standard Deviation (Sample) | 8.7% | 3.5% |
| Standard Deviation (Population) | 8.6% | 3.5% |
Similar Demographics by High School Diploma
Demographics Similar to Immigrants from North America by High School Diploma
In terms of high school diploma, the demographic groups most similar to Immigrants from North America are Slavic (91.0%, a difference of 0.0%), Zimbabwean (91.1%, a difference of 0.010%), Immigrants from Canada (91.1%, a difference of 0.030%), Immigrants from Japan (91.0%, a difference of 0.030%), and Immigrants from Taiwan (91.0%, a difference of 0.040%).
| Demographics | Rating | Rank | High School Diploma |
| Immigrants | Sweden | 99.7 /100 | #52 | Exceptional 91.1% |
| Immigrants | Belgium | 99.7 /100 | #53 | Exceptional 91.1% |
| Macedonians | 99.7 /100 | #54 | Exceptional 91.1% |
| Serbians | 99.7 /100 | #55 | Exceptional 91.1% |
| Immigrants | Canada | 99.7 /100 | #56 | Exceptional 91.1% |
| Zimbabweans | 99.7 /100 | #57 | Exceptional 91.1% |
| Slavs | 99.7 /100 | #58 | Exceptional 91.0% |
| Immigrants | North America | 99.7 /100 | #59 | Exceptional 91.0% |
| Immigrants | Japan | 99.6 /100 | #60 | Exceptional 91.0% |
| Immigrants | Taiwan | 99.6 /100 | #61 | Exceptional 91.0% |
| Austrians | 99.6 /100 | #62 | Exceptional 91.0% |
| Immigrants | Netherlands | 99.6 /100 | #63 | Exceptional 91.0% |
| Ukrainians | 99.6 /100 | #64 | Exceptional 91.0% |
| Immigrants | South Africa | 99.6 /100 | #65 | Exceptional 91.0% |
| French | 99.5 /100 | #66 | Exceptional 91.0% |
Demographics Similar to Immigrants from Iraq by High School Diploma
In terms of high school diploma, the demographic groups most similar to Immigrants from Iraq are Alsatian (89.4%, a difference of 0.030%), Asian (89.4%, a difference of 0.040%), Immigrants from Northern Africa (89.4%, a difference of 0.040%), Paraguayan (89.5%, a difference of 0.050%), and Immigrants from Argentina (89.4%, a difference of 0.050%).
| Demographics | Rating | Rank | High School Diploma |
| Immigrants | Spain | 76.2 /100 | #146 | Good 89.5% |
| Iraqis | 73.9 /100 | #147 | Good 89.5% |
| Immigrants | Lebanon | 73.4 /100 | #148 | Good 89.5% |
| Immigrants | Poland | 72.9 /100 | #149 | Good 89.5% |
| Argentineans | 72.3 /100 | #150 | Good 89.5% |
| Paraguayans | 71.4 /100 | #151 | Good 89.5% |
| Asians | 70.7 /100 | #152 | Good 89.4% |
| Immigrants | Iraq | 68.7 /100 | #153 | Good 89.4% |
| Alsatians | 66.8 /100 | #154 | Good 89.4% |
| Immigrants | Northern Africa | 66.4 /100 | #155 | Good 89.4% |
| Immigrants | Argentina | 65.5 /100 | #156 | Good 89.4% |
| Immigrants | Malaysia | 63.5 /100 | #157 | Good 89.3% |
| Immigrants | Pakistan | 62.5 /100 | #158 | Good 89.3% |
| Immigrants | China | 62.0 /100 | #159 | Good 89.3% |
| Laotians | 61.8 /100 | #160 | Good 89.3% |