Honduran vs Danish Hearing Disability
COMPARE
Honduran
Danish
Hearing Disability
Hearing Disability Comparison
Hondurans
Danes
2.8%
HEARING DISABILITY
93.4/ 100
METRIC RATING
106th/ 347
METRIC RANK
3.6%
HEARING DISABILITY
0.0/ 100
METRIC RATING
276th/ 347
METRIC RANK
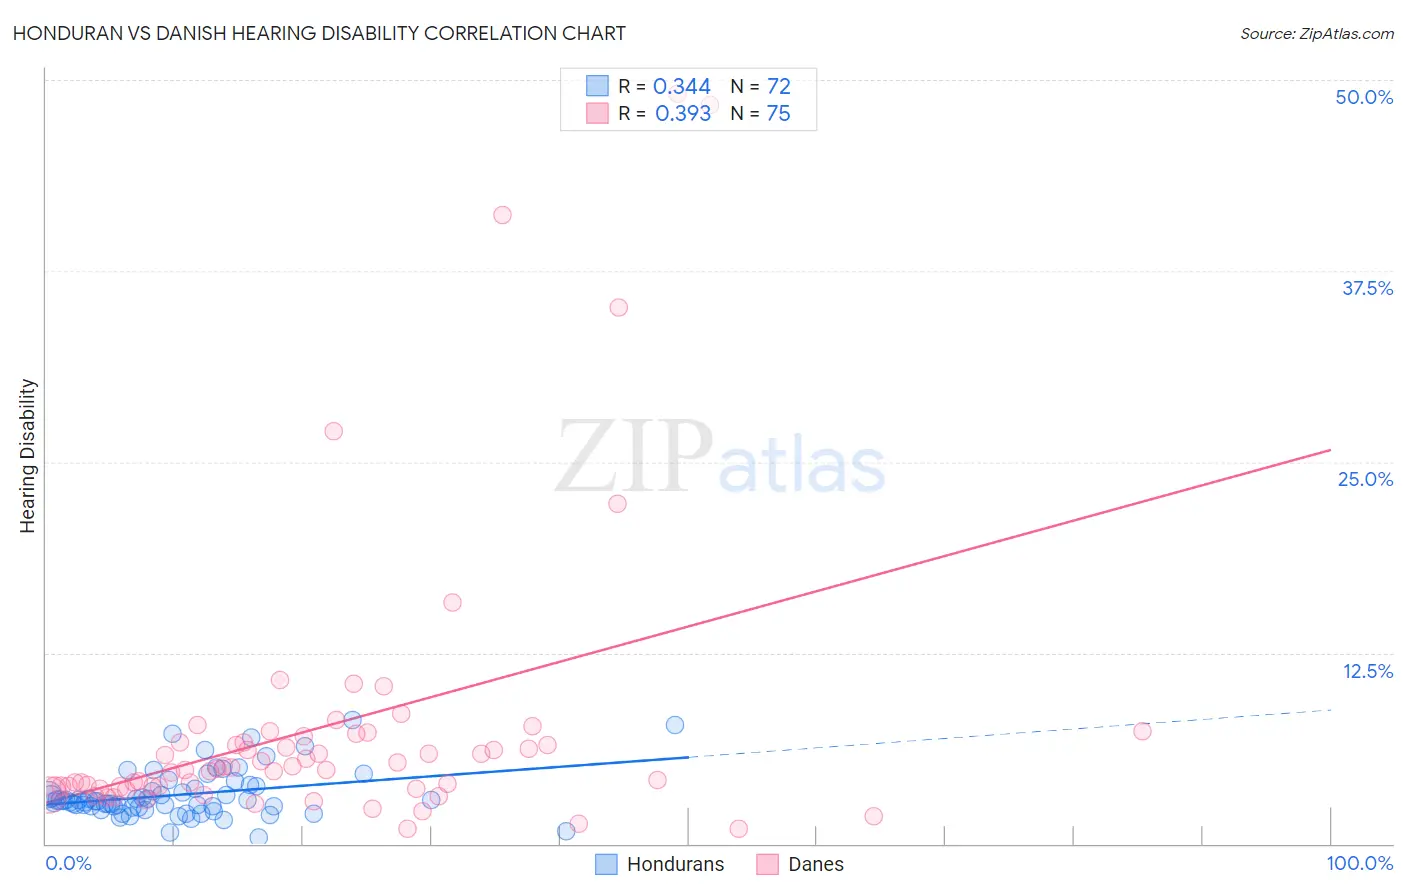
Honduran vs Danish Hearing Disability Correlation Chart
The statistical analysis conducted on geographies consisting of 357,671,786 people shows a mild positive correlation between the proportion of Hondurans and percentage of population with hearing disability in the United States with a correlation coefficient (R) of 0.344 and weighted average of 2.8%. Similarly, the statistical analysis conducted on geographies consisting of 473,961,057 people shows a mild positive correlation between the proportion of Danes and percentage of population with hearing disability in the United States with a correlation coefficient (R) of 0.393 and weighted average of 3.6%, a difference of 26.6%.
Hearing Disability Correlation Summary
| Measurement | Honduran | Danish |
| Minimum | 0.44% | 0.96% |
| Maximum | 8.1% | 49.1% |
| Range | 7.6% | 48.2% |
| Mean | 3.2% | 7.7% |
| Median | 2.8% | 4.9% |
| Interquartile 25% (IQ1) | 2.4% | 3.7% |
| Interquartile 75% (IQ3) | 3.7% | 7.1% |
| Interquartile Range (IQR) | 1.2% | 3.4% |
| Standard Deviation (Sample) | 1.6% | 9.5% |
| Standard Deviation (Population) | 1.5% | 9.5% |
Similar Demographics by Hearing Disability
Demographics Similar to Hondurans by Hearing Disability
In terms of hearing disability, the demographic groups most similar to Hondurans are Immigrants from Chile (2.8%, a difference of 0.0%), Guatemalan (2.8%, a difference of 0.080%), Turkish (2.8%, a difference of 0.15%), Cypriot (2.8%, a difference of 0.20%), and Moroccan (2.8%, a difference of 0.24%).
| Demographics | Rating | Rank | Hearing Disability |
| Immigrants | Guatemala | 95.1 /100 | #99 | Exceptional 2.8% |
| Immigrants | Eastern Africa | 95.0 /100 | #100 | Exceptional 2.8% |
| Immigrants | Spain | 94.9 /100 | #101 | Exceptional 2.8% |
| Taiwanese | 94.8 /100 | #102 | Exceptional 2.8% |
| Immigrants | Indonesia | 94.7 /100 | #103 | Exceptional 2.8% |
| Burmese | 94.2 /100 | #104 | Exceptional 2.8% |
| Moroccans | 93.9 /100 | #105 | Exceptional 2.8% |
| Hondurans | 93.4 /100 | #106 | Exceptional 2.8% |
| Immigrants | Chile | 93.4 /100 | #107 | Exceptional 2.8% |
| Guatemalans | 93.2 /100 | #108 | Exceptional 2.8% |
| Turks | 93.0 /100 | #109 | Exceptional 2.8% |
| Cypriots | 92.9 /100 | #110 | Exceptional 2.8% |
| Immigrants | Yemen | 92.7 /100 | #111 | Exceptional 2.8% |
| U.S. Virgin Islanders | 92.5 /100 | #112 | Exceptional 2.8% |
| Immigrants | Belarus | 91.6 /100 | #113 | Exceptional 2.8% |
Demographics Similar to Danes by Hearing Disability
In terms of hearing disability, the demographic groups most similar to Danes are Czechoslovakian (3.6%, a difference of 0.12%), Swiss (3.5%, a difference of 0.32%), Puerto Rican (3.5%, a difference of 0.64%), Nonimmigrants (3.6%, a difference of 0.70%), and Fijian (3.5%, a difference of 0.72%).
| Demographics | Rating | Rank | Hearing Disability |
| Ute | 0.1 /100 | #269 | Tragic 3.5% |
| Europeans | 0.1 /100 | #270 | Tragic 3.5% |
| Czechs | 0.1 /100 | #271 | Tragic 3.5% |
| Fijians | 0.0 /100 | #272 | Tragic 3.5% |
| Puerto Ricans | 0.0 /100 | #273 | Tragic 3.5% |
| Swiss | 0.0 /100 | #274 | Tragic 3.5% |
| Czechoslovakians | 0.0 /100 | #275 | Tragic 3.6% |
| Danes | 0.0 /100 | #276 | Tragic 3.6% |
| Immigrants | Nonimmigrants | 0.0 /100 | #277 | Tragic 3.6% |
| Basques | 0.0 /100 | #278 | Tragic 3.6% |
| Slovaks | 0.0 /100 | #279 | Tragic 3.6% |
| French American Indians | 0.0 /100 | #280 | Tragic 3.6% |
| Scandinavians | 0.0 /100 | #281 | Tragic 3.6% |
| Swedes | 0.0 /100 | #282 | Tragic 3.6% |
| Blackfeet | 0.0 /100 | #283 | Tragic 3.6% |