British vs Estonian Ambulatory Disability
COMPARE
British
Estonian
Ambulatory Disability
Ambulatory Disability Comparison
British
Estonians
6.2%
AMBULATORY DISABILITY
34.3/ 100
METRIC RATING
188th/ 347
METRIC RANK
5.9%
AMBULATORY DISABILITY
92.9/ 100
METRIC RATING
120th/ 347
METRIC RANK
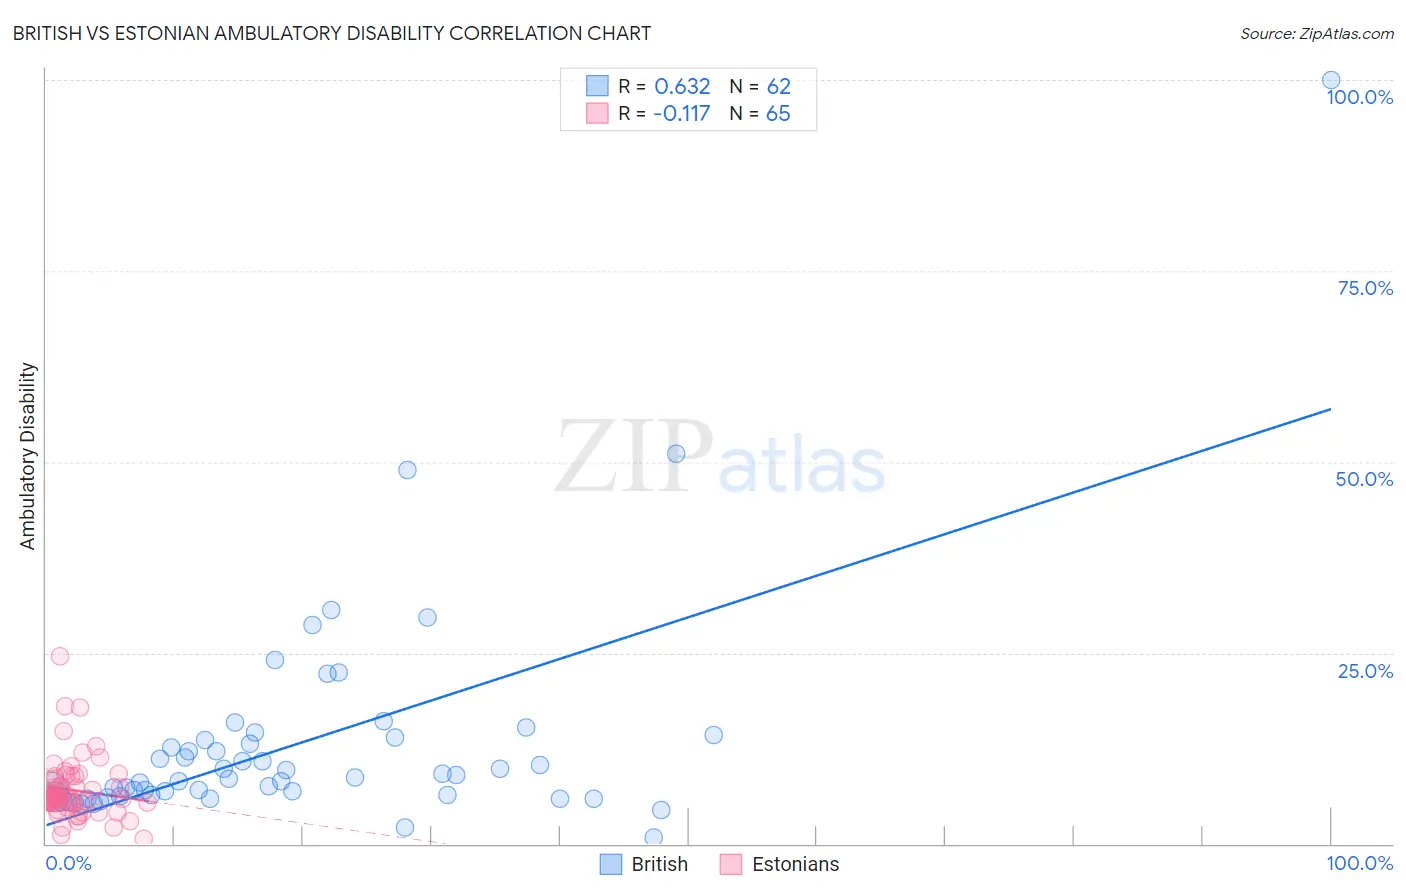
British vs Estonian Ambulatory Disability Correlation Chart
The statistical analysis conducted on geographies consisting of 531,154,282 people shows a significant positive correlation between the proportion of British and percentage of population with ambulatory disability in the United States with a correlation coefficient (R) of 0.632 and weighted average of 6.2%. Similarly, the statistical analysis conducted on geographies consisting of 123,516,931 people shows a poor negative correlation between the proportion of Estonians and percentage of population with ambulatory disability in the United States with a correlation coefficient (R) of -0.117 and weighted average of 5.9%, a difference of 4.4%.
Ambulatory Disability Correlation Summary
| Measurement | British | Estonian |
| Minimum | 0.87% | 0.64% |
| Maximum | 100.0% | 24.6% |
| Range | 99.1% | 24.0% |
| Mean | 13.1% | 7.0% |
| Median | 8.6% | 5.9% |
| Interquartile 25% (IQ1) | 6.3% | 5.4% |
| Interquartile 75% (IQ3) | 13.6% | 8.6% |
| Interquartile Range (IQR) | 7.3% | 3.3% |
| Standard Deviation (Sample) | 14.6% | 4.0% |
| Standard Deviation (Population) | 14.5% | 3.9% |
Similar Demographics by Ambulatory Disability
Demographics Similar to British by Ambulatory Disability
In terms of ambulatory disability, the demographic groups most similar to British are Ukrainian (6.2%, a difference of 0.020%), Immigrants from Western Africa (6.2%, a difference of 0.050%), Carpatho Rusyn (6.2%, a difference of 0.060%), European (6.2%, a difference of 0.11%), and Immigrants from Guatemala (6.2%, a difference of 0.14%).
| Demographics | Rating | Rank | Ambulatory Disability |
| Swiss | 43.1 /100 | #181 | Average 6.1% |
| Serbians | 42.8 /100 | #182 | Average 6.1% |
| Immigrants | Thailand | 42.2 /100 | #183 | Average 6.1% |
| Immigrants | Ghana | 41.2 /100 | #184 | Average 6.1% |
| Immigrants | Bosnia and Herzegovina | 37.2 /100 | #185 | Fair 6.2% |
| Europeans | 36.2 /100 | #186 | Fair 6.2% |
| Carpatho Rusyns | 35.3 /100 | #187 | Fair 6.2% |
| British | 34.3 /100 | #188 | Fair 6.2% |
| Ukrainians | 34.0 /100 | #189 | Fair 6.2% |
| Immigrants | Western Africa | 33.4 /100 | #190 | Fair 6.2% |
| Immigrants | Guatemala | 31.9 /100 | #191 | Fair 6.2% |
| Immigrants | Western Europe | 31.6 /100 | #192 | Fair 6.2% |
| Guatemalans | 30.0 /100 | #193 | Fair 6.2% |
| Alaska Natives | 29.8 /100 | #194 | Fair 6.2% |
| Belgians | 28.6 /100 | #195 | Fair 6.2% |
Demographics Similar to Estonians by Ambulatory Disability
In terms of ambulatory disability, the demographic groups most similar to Estonians are Norwegian (5.9%, a difference of 0.040%), Costa Rican (5.9%, a difference of 0.070%), Icelander (5.9%, a difference of 0.070%), Immigrants from Russia (5.9%, a difference of 0.10%), and Russian (5.9%, a difference of 0.11%).
| Demographics | Rating | Rank | Ambulatory Disability |
| Immigrants | Uruguay | 95.6 /100 | #113 | Exceptional 5.9% |
| Immigrants | Poland | 95.4 /100 | #114 | Exceptional 5.9% |
| South American Indians | 94.8 /100 | #115 | Exceptional 5.9% |
| Immigrants | Africa | 94.7 /100 | #116 | Exceptional 5.9% |
| Immigrants | South Eastern Asia | 93.6 /100 | #117 | Exceptional 5.9% |
| Russians | 93.4 /100 | #118 | Exceptional 5.9% |
| Norwegians | 93.1 /100 | #119 | Exceptional 5.9% |
| Estonians | 92.9 /100 | #120 | Exceptional 5.9% |
| Costa Ricans | 92.6 /100 | #121 | Exceptional 5.9% |
| Icelanders | 92.6 /100 | #122 | Exceptional 5.9% |
| Immigrants | Russia | 92.4 /100 | #123 | Exceptional 5.9% |
| Immigrants | Middle Africa | 92.2 /100 | #124 | Exceptional 5.9% |
| Koreans | 91.6 /100 | #125 | Exceptional 5.9% |
| Arabs | 91.5 /100 | #126 | Exceptional 5.9% |
| Immigrants | Nigeria | 90.9 /100 | #127 | Exceptional 5.9% |