Immigrants from Nicaragua vs Sudanese Cognitive Disability
COMPARE
Immigrants from Nicaragua
Sudanese
Cognitive Disability
Cognitive Disability Comparison
Immigrants from Nicaragua
Sudanese
16.8%
COGNITIVE DISABILITY
97.8/ 100
METRIC RATING
107th/ 347
METRIC RANK
18.9%
COGNITIVE DISABILITY
0.0/ 100
METRIC RATING
334th/ 347
METRIC RANK
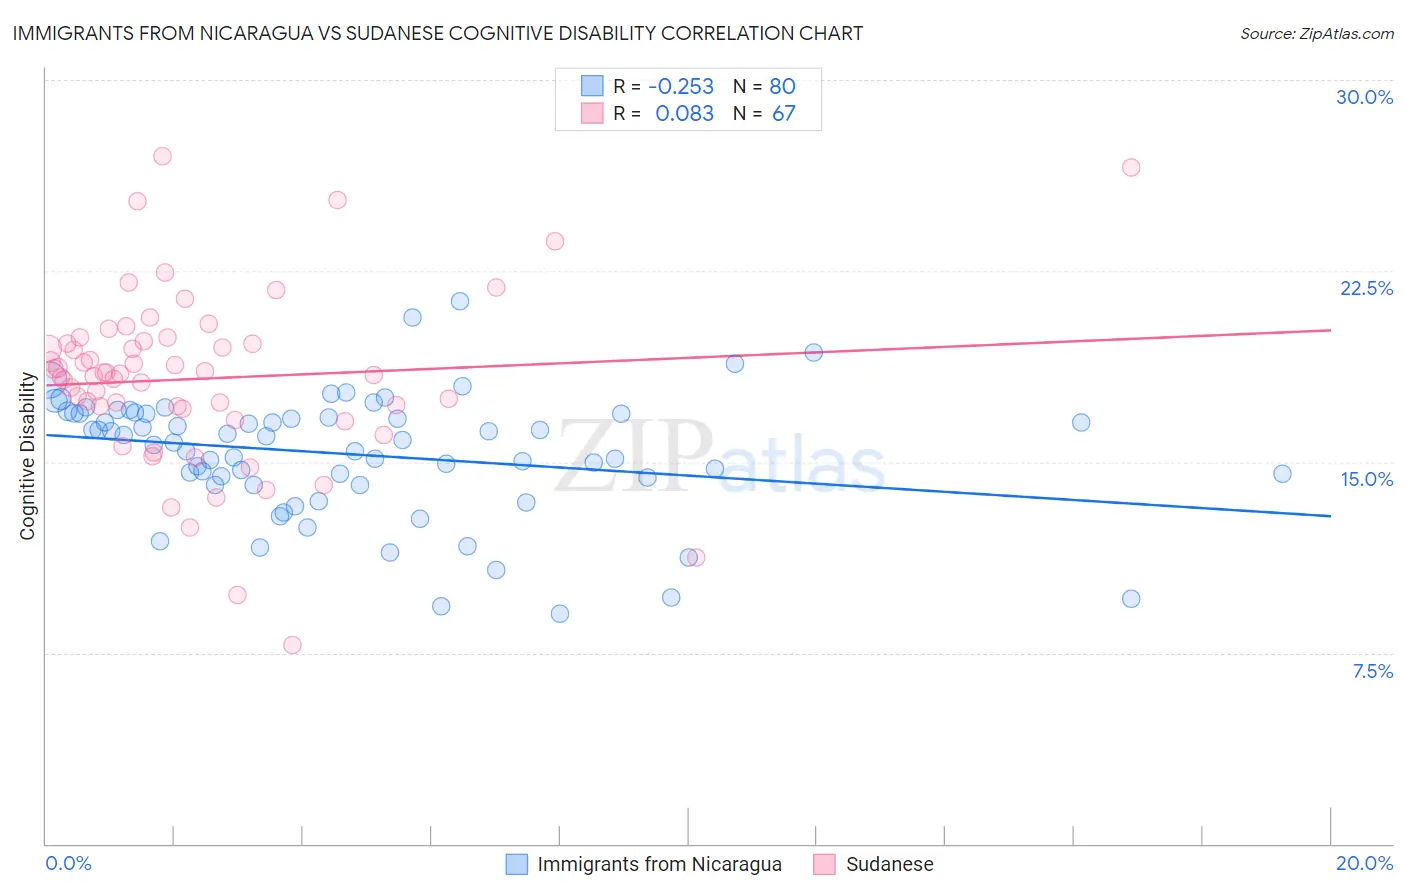
Immigrants from Nicaragua vs Sudanese Cognitive Disability Correlation Chart
The statistical analysis conducted on geographies consisting of 236,326,974 people shows a weak negative correlation between the proportion of Immigrants from Nicaragua and percentage of population with cognitive disability in the United States with a correlation coefficient (R) of -0.253 and weighted average of 16.8%. Similarly, the statistical analysis conducted on geographies consisting of 110,121,585 people shows a slight positive correlation between the proportion of Sudanese and percentage of population with cognitive disability in the United States with a correlation coefficient (R) of 0.083 and weighted average of 18.9%, a difference of 12.3%.
Cognitive Disability Correlation Summary
| Measurement | Immigrants from Nicaragua | Sudanese |
| Minimum | 9.1% | 7.8% |
| Maximum | 21.3% | 27.0% |
| Range | 12.2% | 19.2% |
| Mean | 15.3% | 18.3% |
| Median | 15.8% | 18.4% |
| Interquartile 25% (IQ1) | 14.2% | 17.1% |
| Interquartile 75% (IQ3) | 16.9% | 19.7% |
| Interquartile Range (IQR) | 2.7% | 2.7% |
| Standard Deviation (Sample) | 2.4% | 3.5% |
| Standard Deviation (Population) | 2.4% | 3.4% |
Similar Demographics by Cognitive Disability
Demographics Similar to Immigrants from Nicaragua by Cognitive Disability
In terms of cognitive disability, the demographic groups most similar to Immigrants from Nicaragua are Northern European (16.8%, a difference of 0.020%), Immigrants from Eastern Asia (16.8%, a difference of 0.060%), Paraguayan (16.8%, a difference of 0.070%), Palestinian (16.8%, a difference of 0.070%), and Canadian (16.8%, a difference of 0.090%).
| Demographics | Rating | Rank | Cognitive Disability |
| Immigrants | Russia | 98.2 /100 | #100 | Exceptional 16.8% |
| Immigrants | Asia | 98.1 /100 | #101 | Exceptional 16.8% |
| Irish | 98.1 /100 | #102 | Exceptional 16.8% |
| Paraguayans | 98.0 /100 | #103 | Exceptional 16.8% |
| Palestinians | 98.0 /100 | #104 | Exceptional 16.8% |
| Immigrants | Eastern Asia | 97.9 /100 | #105 | Exceptional 16.8% |
| Northern Europeans | 97.8 /100 | #106 | Exceptional 16.8% |
| Immigrants | Nicaragua | 97.8 /100 | #107 | Exceptional 16.8% |
| Canadians | 97.5 /100 | #108 | Exceptional 16.8% |
| Albanians | 97.3 /100 | #109 | Exceptional 16.8% |
| Arapaho | 97.3 /100 | #110 | Exceptional 16.8% |
| Uruguayans | 97.2 /100 | #111 | Exceptional 16.8% |
| Indians (Asian) | 97.2 /100 | #112 | Exceptional 16.8% |
| Immigrants | Sri Lanka | 97.1 /100 | #113 | Exceptional 16.8% |
| Koreans | 97.1 /100 | #114 | Exceptional 16.8% |
Demographics Similar to Sudanese by Cognitive Disability
In terms of cognitive disability, the demographic groups most similar to Sudanese are Immigrants from Yemen (18.8%, a difference of 0.38%), Immigrants from Sudan (18.8%, a difference of 0.44%), Pima (18.8%, a difference of 0.45%), Immigrants from Dominican Republic (18.8%, a difference of 0.52%), and Senegalese (19.0%, a difference of 0.54%).
| Demographics | Rating | Rank | Cognitive Disability |
| U.S. Virgin Islanders | 0.0 /100 | #327 | Tragic 18.7% |
| Kiowa | 0.0 /100 | #328 | Tragic 18.7% |
| Navajo | 0.0 /100 | #329 | Tragic 18.8% |
| Immigrants | Dominican Republic | 0.0 /100 | #330 | Tragic 18.8% |
| Pima | 0.0 /100 | #331 | Tragic 18.8% |
| Immigrants | Sudan | 0.0 /100 | #332 | Tragic 18.8% |
| Immigrants | Yemen | 0.0 /100 | #333 | Tragic 18.8% |
| Sudanese | 0.0 /100 | #334 | Tragic 18.9% |
| Senegalese | 0.0 /100 | #335 | Tragic 19.0% |
| Blacks/African Americans | 0.0 /100 | #336 | Tragic 19.0% |
| Immigrants | Saudi Arabia | 0.0 /100 | #337 | Tragic 19.1% |
| Lumbee | 0.0 /100 | #338 | Tragic 19.1% |
| Puerto Ricans | 0.0 /100 | #339 | Tragic 19.2% |
| Cape Verdeans | 0.0 /100 | #340 | Tragic 19.2% |
| Tohono O'odham | 0.0 /100 | #341 | Tragic 19.3% |