Immigrants from Brazil vs Immigrants from Indonesia Disability Age 5 to 17
COMPARE
Immigrants from Brazil
Immigrants from Indonesia
Disability Age 5 to 17
Disability Age 5 to 17 Comparison
Immigrants from Brazil
Immigrants from Indonesia
5.8%
DISABILITY AGE 5 TO 17
3.2/ 100
METRIC RATING
236th/ 347
METRIC RANK
5.0%
DISABILITY AGE 5 TO 17
100.0/ 100
METRIC RATING
33rd/ 347
METRIC RANK
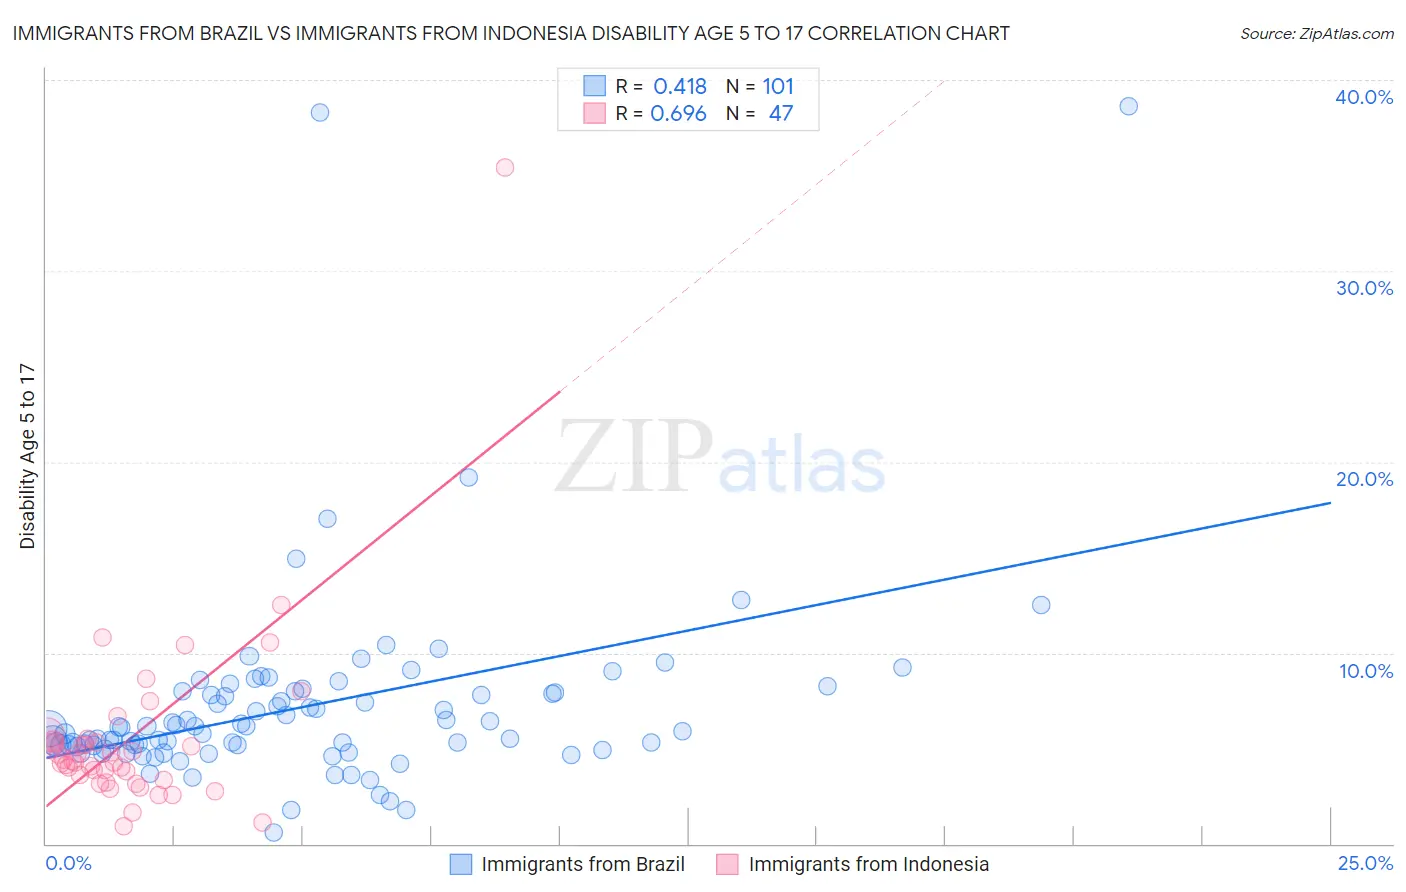
Immigrants from Brazil vs Immigrants from Indonesia Disability Age 5 to 17 Correlation Chart
The statistical analysis conducted on geographies consisting of 340,728,736 people shows a moderate positive correlation between the proportion of Immigrants from Brazil and percentage of population with a disability between the ages 5 and 17 in the United States with a correlation coefficient (R) of 0.418 and weighted average of 5.8%. Similarly, the statistical analysis conducted on geographies consisting of 214,816,459 people shows a significant positive correlation between the proportion of Immigrants from Indonesia and percentage of population with a disability between the ages 5 and 17 in the United States with a correlation coefficient (R) of 0.696 and weighted average of 5.0%, a difference of 17.0%.
Disability Age 5 to 17 Correlation Summary
| Measurement | Immigrants from Brazil | Immigrants from Indonesia |
| Minimum | 0.57% | 0.90% |
| Maximum | 38.7% | 35.4% |
| Range | 38.1% | 34.5% |
| Mean | 7.2% | 5.5% |
| Median | 6.0% | 4.4% |
| Interquartile 25% (IQ1) | 5.1% | 3.3% |
| Interquartile 75% (IQ3) | 8.0% | 5.4% |
| Interquartile Range (IQR) | 2.8% | 2.0% |
| Standard Deviation (Sample) | 5.3% | 5.1% |
| Standard Deviation (Population) | 5.3% | 5.0% |
Similar Demographics by Disability Age 5 to 17
Demographics Similar to Immigrants from Brazil by Disability Age 5 to 17
In terms of disability age 5 to 17, the demographic groups most similar to Immigrants from Brazil are Malaysian (5.8%, a difference of 0.060%), Immigrants from Kenya (5.8%, a difference of 0.070%), Immigrants from West Indies (5.8%, a difference of 0.11%), Sudanese (5.8%, a difference of 0.15%), and Immigrants from Laos (5.8%, a difference of 0.20%).
| Demographics | Rating | Rank | Disability Age 5 to 17 |
| Bangladeshis | 4.8 /100 | #229 | Tragic 5.8% |
| Ghanaians | 4.7 /100 | #230 | Tragic 5.8% |
| Europeans | 4.5 /100 | #231 | Tragic 5.8% |
| Immigrants | Laos | 3.8 /100 | #232 | Tragic 5.8% |
| Immigrants | West Indies | 3.5 /100 | #233 | Tragic 5.8% |
| Immigrants | Kenya | 3.4 /100 | #234 | Tragic 5.8% |
| Malaysians | 3.4 /100 | #235 | Tragic 5.8% |
| Immigrants | Brazil | 3.2 /100 | #236 | Tragic 5.8% |
| Sudanese | 2.9 /100 | #237 | Tragic 5.8% |
| Hungarians | 2.6 /100 | #238 | Tragic 5.8% |
| German Russians | 2.4 /100 | #239 | Tragic 5.9% |
| West Indians | 2.4 /100 | #240 | Tragic 5.9% |
| Immigrants | Caribbean | 2.1 /100 | #241 | Tragic 5.9% |
| Spaniards | 2.0 /100 | #242 | Tragic 5.9% |
| Indonesians | 2.0 /100 | #243 | Tragic 5.9% |
Demographics Similar to Immigrants from Indonesia by Disability Age 5 to 17
In terms of disability age 5 to 17, the demographic groups most similar to Immigrants from Indonesia are Israeli (5.0%, a difference of 0.12%), Bolivian (5.0%, a difference of 0.30%), Soviet Union (5.0%, a difference of 0.32%), Immigrants from Egypt (5.0%, a difference of 0.35%), and Immigrants from Pakistan (5.0%, a difference of 0.36%).
| Demographics | Rating | Rank | Disability Age 5 to 17 |
| Bhutanese | 100.0 /100 | #26 | Exceptional 4.9% |
| Taiwanese | 100.0 /100 | #27 | Exceptional 4.9% |
| Immigrants | Japan | 100.0 /100 | #28 | Exceptional 4.9% |
| Immigrants | Serbia | 100.0 /100 | #29 | Exceptional 4.9% |
| Immigrants | Malaysia | 100.0 /100 | #30 | Exceptional 5.0% |
| Immigrants | Pakistan | 100.0 /100 | #31 | Exceptional 5.0% |
| Soviet Union | 100.0 /100 | #32 | Exceptional 5.0% |
| Immigrants | Indonesia | 100.0 /100 | #33 | Exceptional 5.0% |
| Israelis | 100.0 /100 | #34 | Exceptional 5.0% |
| Bolivians | 100.0 /100 | #35 | Exceptional 5.0% |
| Immigrants | Egypt | 100.0 /100 | #36 | Exceptional 5.0% |
| Immigrants | Belarus | 100.0 /100 | #37 | Exceptional 5.0% |
| Immigrants | Philippines | 100.0 /100 | #38 | Exceptional 5.0% |
| Immigrants | Argentina | 100.0 /100 | #39 | Exceptional 5.0% |
| Okinawans | 100.0 /100 | #40 | Exceptional 5.0% |