Immigrants from Netherlands vs Bhutanese Ambulatory Disability
COMPARE
Immigrants from Netherlands
Bhutanese
Ambulatory Disability
Ambulatory Disability Comparison
Immigrants from Netherlands
Bhutanese
5.8%
AMBULATORY DISABILITY
97.1/ 100
METRIC RATING
109th/ 347
METRIC RANK
5.8%
AMBULATORY DISABILITY
98.8/ 100
METRIC RATING
89th/ 347
METRIC RANK
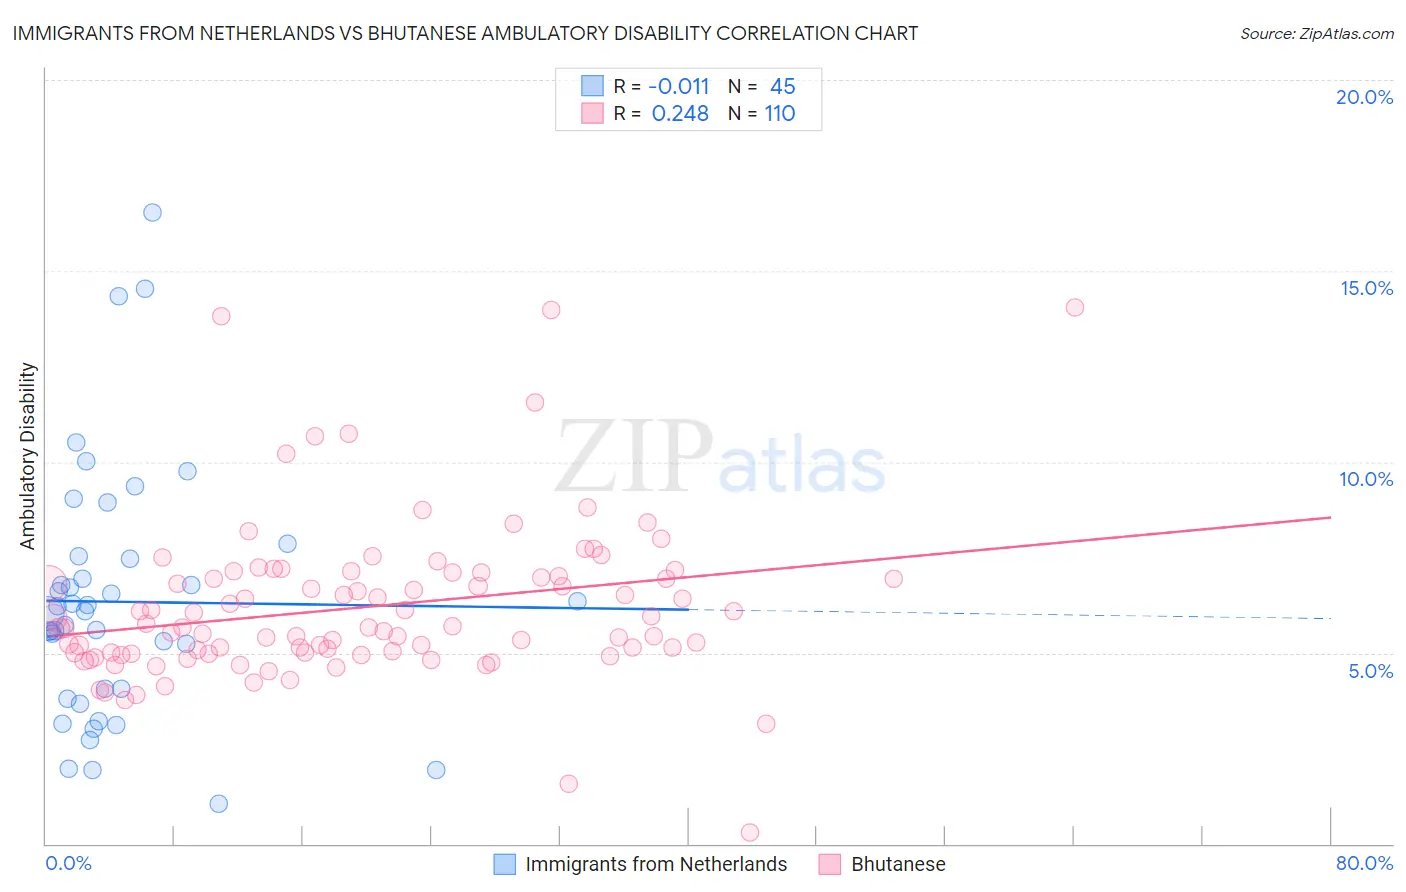
Immigrants from Netherlands vs Bhutanese Ambulatory Disability Correlation Chart
The statistical analysis conducted on geographies consisting of 237,838,654 people shows no correlation between the proportion of Immigrants from Netherlands and percentage of population with ambulatory disability in the United States with a correlation coefficient (R) of -0.011 and weighted average of 5.8%. Similarly, the statistical analysis conducted on geographies consisting of 455,305,094 people shows a weak positive correlation between the proportion of Bhutanese and percentage of population with ambulatory disability in the United States with a correlation coefficient (R) of 0.248 and weighted average of 5.8%, a difference of 1.3%.
Ambulatory Disability Correlation Summary
| Measurement | Immigrants from Netherlands | Bhutanese |
| Minimum | 1.1% | 0.28% |
| Maximum | 16.5% | 14.0% |
| Range | 15.5% | 13.8% |
| Mean | 6.3% | 6.2% |
| Median | 6.1% | 5.7% |
| Interquartile 25% (IQ1) | 3.9% | 5.0% |
| Interquartile 75% (IQ3) | 7.5% | 7.0% |
| Interquartile Range (IQR) | 3.6% | 2.0% |
| Standard Deviation (Sample) | 3.3% | 2.1% |
| Standard Deviation (Population) | 3.3% | 2.1% |
Demographics Similar to Immigrants from Netherlands and Bhutanese by Ambulatory Disability
In terms of ambulatory disability, the demographic groups most similar to Immigrants from Netherlands are Colombian (5.8%, a difference of 0.020%), Uruguayan (5.8%, a difference of 0.030%), Immigrants from Morocco (5.8%, a difference of 0.080%), Immigrants from Czechoslovakia (5.8%, a difference of 0.15%), and New Zealander (5.8%, a difference of 0.26%). Similarly, the demographic groups most similar to Bhutanese are Australian (5.8%, a difference of 0.0%), Immigrants from Sudan (5.8%, a difference of 0.0%), Immigrants from Sierra Leone (5.8%, a difference of 0.17%), Immigrants from Denmark (5.8%, a difference of 0.18%), and Kenyan (5.8%, a difference of 0.37%).
| Demographics | Rating | Rank | Ambulatory Disability |
| Bhutanese | 98.8 /100 | #89 | Exceptional 5.8% |
| Australians | 98.8 /100 | #90 | Exceptional 5.8% |
| Immigrants | Sudan | 98.8 /100 | #91 | Exceptional 5.8% |
| Immigrants | Sierra Leone | 98.6 /100 | #92 | Exceptional 5.8% |
| Immigrants | Denmark | 98.6 /100 | #93 | Exceptional 5.8% |
| Kenyans | 98.4 /100 | #94 | Exceptional 5.8% |
| Immigrants | El Salvador | 98.4 /100 | #95 | Exceptional 5.8% |
| Salvadorans | 98.4 /100 | #96 | Exceptional 5.8% |
| Immigrants | Somalia | 98.3 /100 | #97 | Exceptional 5.8% |
| Immigrants | Lebanon | 98.3 /100 | #98 | Exceptional 5.8% |
| Immigrants | Northern Europe | 98.2 /100 | #99 | Exceptional 5.8% |
| Immigrants | Serbia | 97.9 /100 | #100 | Exceptional 5.8% |
| Immigrants | South America | 97.9 /100 | #101 | Exceptional 5.8% |
| Immigrants | Kenya | 97.8 /100 | #102 | Exceptional 5.8% |
| Immigrants | Romania | 97.7 /100 | #103 | Exceptional 5.8% |
| New Zealanders | 97.6 /100 | #104 | Exceptional 5.8% |
| Immigrants | Czechoslovakia | 97.4 /100 | #105 | Exceptional 5.8% |
| Immigrants | Morocco | 97.3 /100 | #106 | Exceptional 5.8% |
| Uruguayans | 97.2 /100 | #107 | Exceptional 5.8% |
| Colombians | 97.2 /100 | #108 | Exceptional 5.8% |
| Immigrants | Netherlands | 97.1 /100 | #109 | Exceptional 5.8% |