Immigrants from Netherlands vs Spanish American Indian Ambulatory Disability
COMPARE
Immigrants from Netherlands
Spanish American Indian
Ambulatory Disability
Ambulatory Disability Comparison
Immigrants from Netherlands
Spanish American Indians
5.8%
AMBULATORY DISABILITY
97.1/ 100
METRIC RATING
109th/ 347
METRIC RANK
6.5%
AMBULATORY DISABILITY
0.5/ 100
METRIC RATING
258th/ 347
METRIC RANK
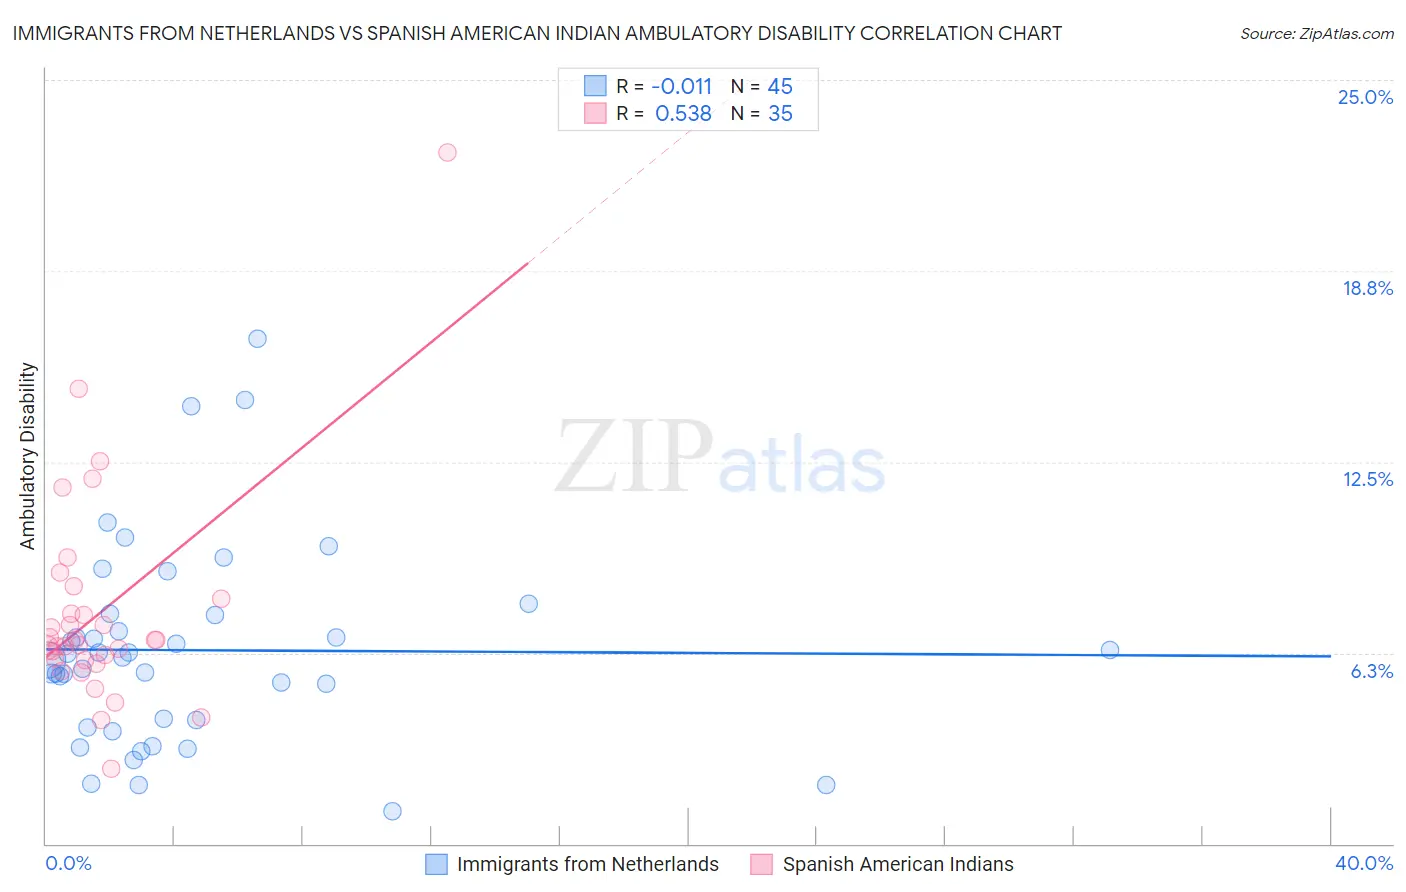
Immigrants from Netherlands vs Spanish American Indian Ambulatory Disability Correlation Chart
The statistical analysis conducted on geographies consisting of 237,838,654 people shows no correlation between the proportion of Immigrants from Netherlands and percentage of population with ambulatory disability in the United States with a correlation coefficient (R) of -0.011 and weighted average of 5.8%. Similarly, the statistical analysis conducted on geographies consisting of 73,149,525 people shows a substantial positive correlation between the proportion of Spanish American Indians and percentage of population with ambulatory disability in the United States with a correlation coefficient (R) of 0.538 and weighted average of 6.5%, a difference of 12.2%.
Ambulatory Disability Correlation Summary
| Measurement | Immigrants from Netherlands | Spanish American Indian |
| Minimum | 1.1% | 2.4% |
| Maximum | 16.5% | 22.6% |
| Range | 15.5% | 20.2% |
| Mean | 6.3% | 7.6% |
| Median | 6.1% | 6.7% |
| Interquartile 25% (IQ1) | 3.9% | 6.0% |
| Interquartile 75% (IQ3) | 7.5% | 8.0% |
| Interquartile Range (IQR) | 3.6% | 2.0% |
| Standard Deviation (Sample) | 3.3% | 3.6% |
| Standard Deviation (Population) | 3.3% | 3.5% |
Similar Demographics by Ambulatory Disability
Demographics Similar to Immigrants from Netherlands by Ambulatory Disability
In terms of ambulatory disability, the demographic groups most similar to Immigrants from Netherlands are Colombian (5.8%, a difference of 0.020%), Uruguayan (5.8%, a difference of 0.030%), Immigrants from Morocco (5.8%, a difference of 0.080%), Immigrants from Czechoslovakia (5.8%, a difference of 0.15%), and Immigrants from Colombia (5.8%, a difference of 0.18%).
| Demographics | Rating | Rank | Ambulatory Disability |
| Immigrants | Kenya | 97.8 /100 | #102 | Exceptional 5.8% |
| Immigrants | Romania | 97.7 /100 | #103 | Exceptional 5.8% |
| New Zealanders | 97.6 /100 | #104 | Exceptional 5.8% |
| Immigrants | Czechoslovakia | 97.4 /100 | #105 | Exceptional 5.8% |
| Immigrants | Morocco | 97.3 /100 | #106 | Exceptional 5.8% |
| Uruguayans | 97.2 /100 | #107 | Exceptional 5.8% |
| Colombians | 97.2 /100 | #108 | Exceptional 5.8% |
| Immigrants | Netherlands | 97.1 /100 | #109 | Exceptional 5.8% |
| Immigrants | Colombia | 96.7 /100 | #110 | Exceptional 5.8% |
| Danes | 96.6 /100 | #111 | Exceptional 5.8% |
| South Africans | 96.3 /100 | #112 | Exceptional 5.9% |
| Immigrants | Uruguay | 95.6 /100 | #113 | Exceptional 5.9% |
| Immigrants | Poland | 95.4 /100 | #114 | Exceptional 5.9% |
| South American Indians | 94.8 /100 | #115 | Exceptional 5.9% |
| Immigrants | Africa | 94.7 /100 | #116 | Exceptional 5.9% |
Demographics Similar to Spanish American Indians by Ambulatory Disability
In terms of ambulatory disability, the demographic groups most similar to Spanish American Indians are Bermudan (6.5%, a difference of 0.080%), Immigrants from Uzbekistan (6.5%, a difference of 0.16%), Aleut (6.6%, a difference of 0.18%), Immigrants from Belize (6.6%, a difference of 0.19%), and Welsh (6.5%, a difference of 0.23%).
| Demographics | Rating | Rank | Ambulatory Disability |
| Hawaiians | 0.9 /100 | #251 | Tragic 6.5% |
| Immigrants | Bahamas | 0.8 /100 | #252 | Tragic 6.5% |
| Scottish | 0.7 /100 | #253 | Tragic 6.5% |
| Belizeans | 0.7 /100 | #254 | Tragic 6.5% |
| Welsh | 0.6 /100 | #255 | Tragic 6.5% |
| Immigrants | Uzbekistan | 0.6 /100 | #256 | Tragic 6.5% |
| Bermudans | 0.5 /100 | #257 | Tragic 6.5% |
| Spanish American Indians | 0.5 /100 | #258 | Tragic 6.5% |
| Aleuts | 0.4 /100 | #259 | Tragic 6.6% |
| Immigrants | Belize | 0.4 /100 | #260 | Tragic 6.6% |
| Irish | 0.4 /100 | #261 | Tragic 6.6% |
| English | 0.4 /100 | #262 | Tragic 6.6% |
| Hmong | 0.3 /100 | #263 | Tragic 6.6% |
| Nepalese | 0.2 /100 | #264 | Tragic 6.6% |
| Bahamians | 0.2 /100 | #265 | Tragic 6.6% |