Immigrants from Netherlands vs Bhutanese Child Poverty Among Girls Under 16
COMPARE
Immigrants from Netherlands
Bhutanese
Child Poverty Among Girls Under 16
Child Poverty Among Girls Under 16 Comparison
Immigrants from Netherlands
Bhutanese
14.6%
CHILD POVERTY AMONG GIRLS UNDER 16
98.1/ 100
METRIC RATING
72nd/ 347
METRIC RANK
12.7%
CHILD POVERTY AMONG GIRLS UNDER 16
100.0/ 100
METRIC RATING
12th/ 347
METRIC RANK
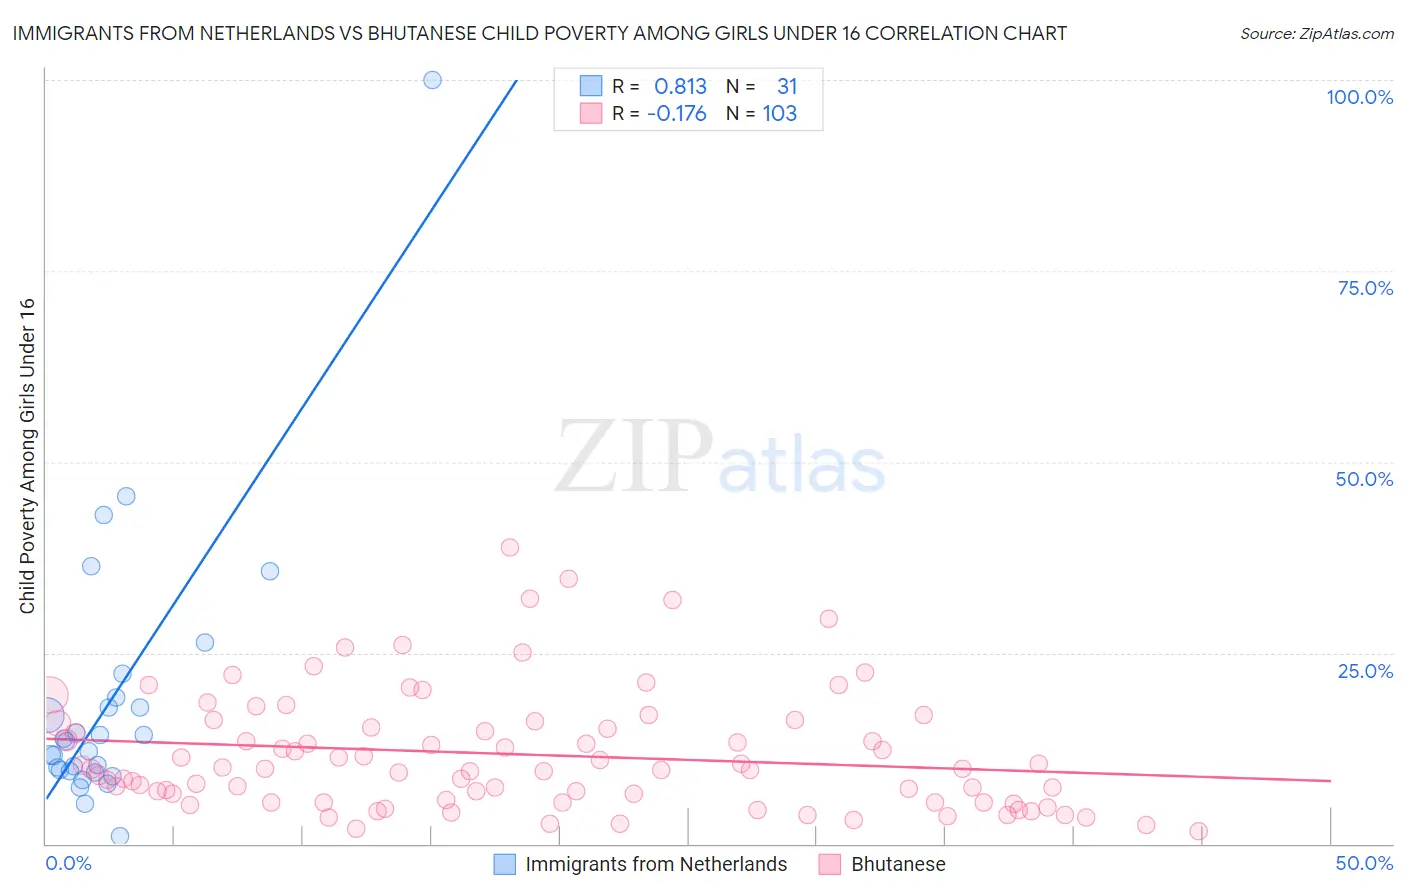
Immigrants from Netherlands vs Bhutanese Child Poverty Among Girls Under 16 Correlation Chart
The statistical analysis conducted on geographies consisting of 234,355,214 people shows a very strong positive correlation between the proportion of Immigrants from Netherlands and poverty level among girls under the age of 16 in the United States with a correlation coefficient (R) of 0.813 and weighted average of 14.6%. Similarly, the statistical analysis conducted on geographies consisting of 445,391,232 people shows a poor negative correlation between the proportion of Bhutanese and poverty level among girls under the age of 16 in the United States with a correlation coefficient (R) of -0.176 and weighted average of 12.7%, a difference of 14.6%.
Child Poverty Among Girls Under 16 Correlation Summary
| Measurement | Immigrants from Netherlands | Bhutanese |
| Minimum | 1.0% | 1.7% |
| Maximum | 100.0% | 38.7% |
| Range | 99.0% | 37.0% |
| Mean | 18.8% | 11.7% |
| Median | 13.4% | 9.8% |
| Interquartile 25% (IQ1) | 9.5% | 5.4% |
| Interquartile 75% (IQ3) | 19.1% | 15.8% |
| Interquartile Range (IQR) | 9.6% | 10.3% |
| Standard Deviation (Sample) | 18.5% | 7.7% |
| Standard Deviation (Population) | 18.2% | 7.7% |
Similar Demographics by Child Poverty Among Girls Under 16
Demographics Similar to Immigrants from Netherlands by Child Poverty Among Girls Under 16
In terms of child poverty among girls under 16, the demographic groups most similar to Immigrants from Netherlands are Slovene (14.6%, a difference of 0.030%), European (14.6%, a difference of 0.060%), Immigrants from Austria (14.6%, a difference of 0.090%), Taiwanese (14.6%, a difference of 0.12%), and Immigrants from Poland (14.6%, a difference of 0.19%).
| Demographics | Rating | Rank | Child Poverty Among Girls Under 16 |
| Immigrants | Sweden | 98.6 /100 | #65 | Exceptional 14.5% |
| Immigrants | Belgium | 98.5 /100 | #66 | Exceptional 14.5% |
| Laotians | 98.4 /100 | #67 | Exceptional 14.5% |
| Immigrants | Argentina | 98.3 /100 | #68 | Exceptional 14.6% |
| Immigrants | Poland | 98.2 /100 | #69 | Exceptional 14.6% |
| Europeans | 98.1 /100 | #70 | Exceptional 14.6% |
| Slovenes | 98.1 /100 | #71 | Exceptional 14.6% |
| Immigrants | Netherlands | 98.1 /100 | #72 | Exceptional 14.6% |
| Immigrants | Austria | 98.0 /100 | #73 | Exceptional 14.6% |
| Taiwanese | 98.0 /100 | #74 | Exceptional 14.6% |
| Immigrants | Eastern Europe | 98.0 /100 | #75 | Exceptional 14.6% |
| Immigrants | Russia | 97.9 /100 | #76 | Exceptional 14.7% |
| Tlingit-Haida | 97.9 /100 | #77 | Exceptional 14.7% |
| Argentineans | 97.9 /100 | #78 | Exceptional 14.7% |
| Immigrants | Turkey | 97.9 /100 | #79 | Exceptional 14.7% |
Demographics Similar to Bhutanese by Child Poverty Among Girls Under 16
In terms of child poverty among girls under 16, the demographic groups most similar to Bhutanese are Immigrants from South Central Asia (12.7%, a difference of 0.040%), Immigrants from Ireland (12.9%, a difference of 1.0%), Immigrants from Iran (12.6%, a difference of 1.3%), Burmese (13.0%, a difference of 2.1%), and Okinawan (13.0%, a difference of 2.1%).
| Demographics | Rating | Rank | Child Poverty Among Girls Under 16 |
| Thais | 100.0 /100 | #5 | Exceptional 11.8% |
| Immigrants | Hong Kong | 100.0 /100 | #6 | Exceptional 12.3% |
| Chinese | 100.0 /100 | #7 | Exceptional 12.3% |
| Iranians | 100.0 /100 | #8 | Exceptional 12.4% |
| Immigrants | Singapore | 100.0 /100 | #9 | Exceptional 12.5% |
| Immigrants | Iran | 100.0 /100 | #10 | Exceptional 12.6% |
| Immigrants | South Central Asia | 100.0 /100 | #11 | Exceptional 12.7% |
| Bhutanese | 100.0 /100 | #12 | Exceptional 12.7% |
| Immigrants | Ireland | 99.9 /100 | #13 | Exceptional 12.9% |
| Burmese | 99.9 /100 | #14 | Exceptional 13.0% |
| Okinawans | 99.9 /100 | #15 | Exceptional 13.0% |
| Immigrants | Lithuania | 99.9 /100 | #16 | Exceptional 13.1% |
| Bulgarians | 99.9 /100 | #17 | Exceptional 13.1% |
| Immigrants | Korea | 99.9 /100 | #18 | Exceptional 13.1% |
| Cypriots | 99.9 /100 | #19 | Exceptional 13.2% |