Immigrants from Nepal vs Immigrants from Kazakhstan 4th Grade
COMPARE
Immigrants from Nepal
Immigrants from Kazakhstan
4th Grade
4th Grade Comparison
Immigrants from Nepal
Immigrants from Kazakhstan
97.3%
4TH GRADE
7.7/ 100
METRIC RATING
214th/ 347
METRIC RANK
97.5%
4TH GRADE
43.6/ 100
METRIC RATING
179th/ 347
METRIC RANK
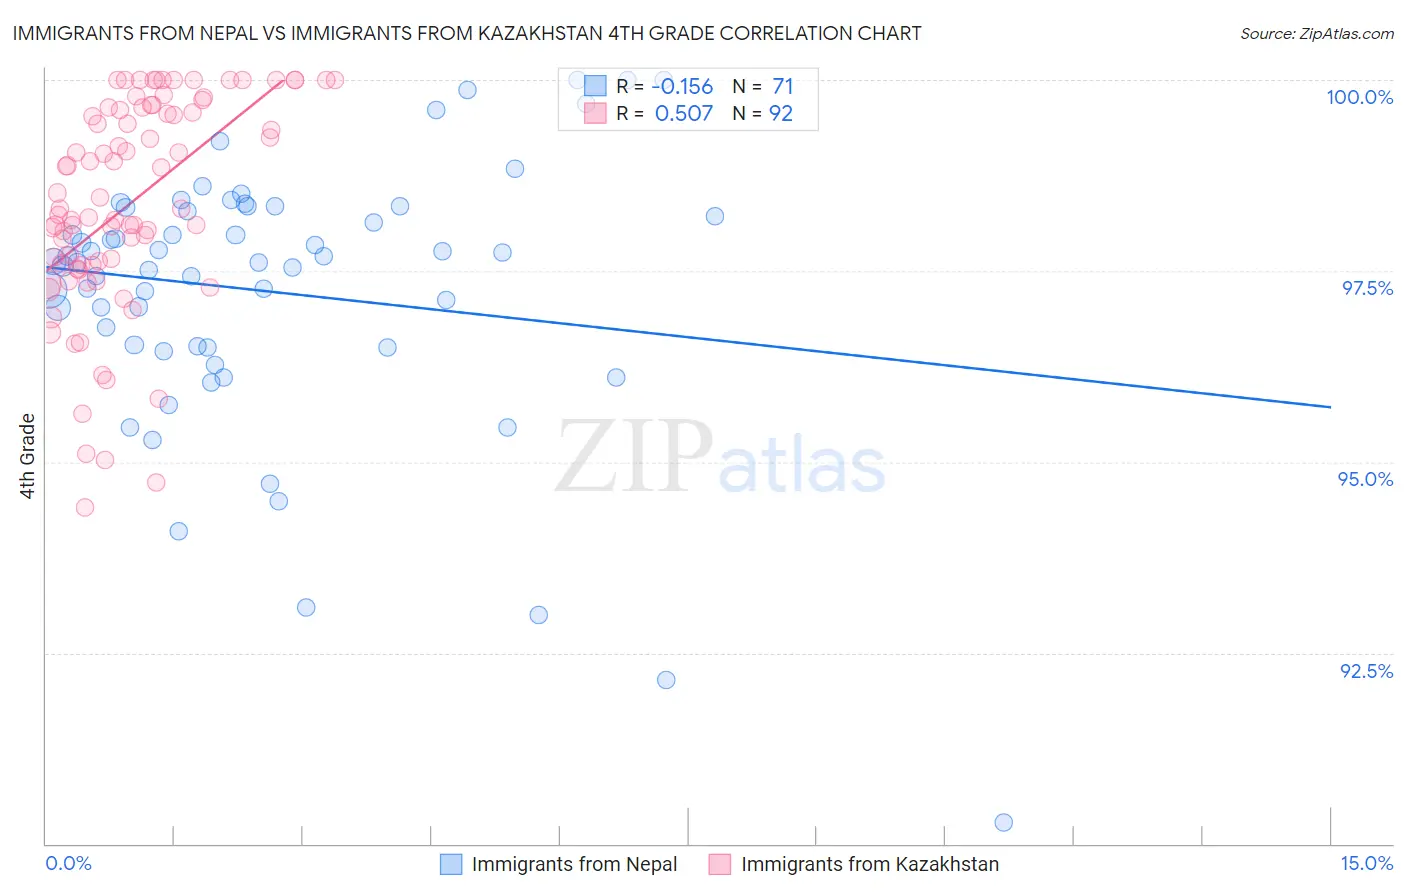
Immigrants from Nepal vs Immigrants from Kazakhstan 4th Grade Correlation Chart
The statistical analysis conducted on geographies consisting of 186,739,570 people shows a poor negative correlation between the proportion of Immigrants from Nepal and percentage of population with at least 4th grade education in the United States with a correlation coefficient (R) of -0.156 and weighted average of 97.3%. Similarly, the statistical analysis conducted on geographies consisting of 124,430,097 people shows a substantial positive correlation between the proportion of Immigrants from Kazakhstan and percentage of population with at least 4th grade education in the United States with a correlation coefficient (R) of 0.507 and weighted average of 97.5%, a difference of 0.21%.
4th Grade Correlation Summary
| Measurement | Immigrants from Nepal | Immigrants from Kazakhstan |
| Minimum | 90.3% | 94.4% |
| Maximum | 100.0% | 100.0% |
| Range | 9.7% | 5.6% |
| Mean | 97.2% | 98.4% |
| Median | 97.6% | 98.3% |
| Interquartile 25% (IQ1) | 96.5% | 97.6% |
| Interquartile 75% (IQ3) | 98.3% | 99.6% |
| Interquartile Range (IQR) | 1.8% | 2.0% |
| Standard Deviation (Sample) | 1.8% | 1.4% |
| Standard Deviation (Population) | 1.8% | 1.4% |
Similar Demographics by 4th Grade
Demographics Similar to Immigrants from Nepal by 4th Grade
In terms of 4th grade, the demographic groups most similar to Immigrants from Nepal are Tohono O'odham (97.3%, a difference of 0.010%), Costa Rican (97.3%, a difference of 0.010%), Immigrants from Morocco (97.3%, a difference of 0.010%), Samoan (97.3%, a difference of 0.010%), and Laotian (97.3%, a difference of 0.020%).
| Demographics | Rating | Rank | 4th Grade |
| Moroccans | 11.3 /100 | #207 | Poor 97.3% |
| Immigrants | Bahamas | 10.8 /100 | #208 | Poor 97.3% |
| Laotians | 9.3 /100 | #209 | Tragic 97.3% |
| Immigrants | Oceania | 9.1 /100 | #210 | Tragic 97.3% |
| Sudanese | 9.0 /100 | #211 | Tragic 97.3% |
| Tohono O'odham | 8.4 /100 | #212 | Tragic 97.3% |
| Costa Ricans | 8.3 /100 | #213 | Tragic 97.3% |
| Immigrants | Nepal | 7.7 /100 | #214 | Tragic 97.3% |
| Immigrants | Morocco | 7.1 /100 | #215 | Tragic 97.3% |
| Samoans | 6.8 /100 | #216 | Tragic 97.3% |
| Sierra Leoneans | 6.5 /100 | #217 | Tragic 97.3% |
| Iraqis | 6.3 /100 | #218 | Tragic 97.3% |
| Tongans | 5.8 /100 | #219 | Tragic 97.3% |
| South American Indians | 5.5 /100 | #220 | Tragic 97.3% |
| Immigrants | Panama | 5.4 /100 | #221 | Tragic 97.3% |
Demographics Similar to Immigrants from Kazakhstan by 4th Grade
In terms of 4th grade, the demographic groups most similar to Immigrants from Kazakhstan are Immigrants from Venezuela (97.5%, a difference of 0.0%), Immigrants from Brazil (97.5%, a difference of 0.010%), Comanche (97.5%, a difference of 0.010%), Immigrants from Taiwan (97.5%, a difference of 0.010%), and Egyptian (97.5%, a difference of 0.020%).
| Demographics | Rating | Rank | 4th Grade |
| Immigrants | Sri Lanka | 51.1 /100 | #172 | Average 97.5% |
| Immigrants | Korea | 50.6 /100 | #173 | Average 97.5% |
| Egyptians | 50.0 /100 | #174 | Average 97.5% |
| Immigrants | Micronesia | 49.6 /100 | #175 | Average 97.5% |
| Arabs | 48.7 /100 | #176 | Average 97.5% |
| Immigrants | Brazil | 46.1 /100 | #177 | Average 97.5% |
| Comanche | 45.3 /100 | #178 | Average 97.5% |
| Immigrants | Kazakhstan | 43.6 /100 | #179 | Average 97.5% |
| Immigrants | Venezuela | 42.7 /100 | #180 | Average 97.5% |
| Immigrants | Taiwan | 41.5 /100 | #181 | Average 97.5% |
| Spanish Americans | 39.3 /100 | #182 | Fair 97.5% |
| Argentineans | 39.0 /100 | #183 | Fair 97.5% |
| Pakistanis | 36.2 /100 | #184 | Fair 97.5% |
| Immigrants | Kenya | 35.8 /100 | #185 | Fair 97.5% |
| Dutch West Indians | 35.8 /100 | #186 | Fair 97.5% |