Immigrants from Nepal vs Belizean In Labor Force | Age 25-29
COMPARE
Immigrants from Nepal
Belizean
In Labor Force | Age 25-29
In Labor Force | Age 25-29 Comparison
Immigrants from Nepal
Belizeans
85.8%
IN LABOR FORCE | AGE 25-29
99.9/ 100
METRIC RATING
36th/ 347
METRIC RANK
83.1%
IN LABOR FORCE | AGE 25-29
0.0/ 100
METRIC RATING
285th/ 347
METRIC RANK
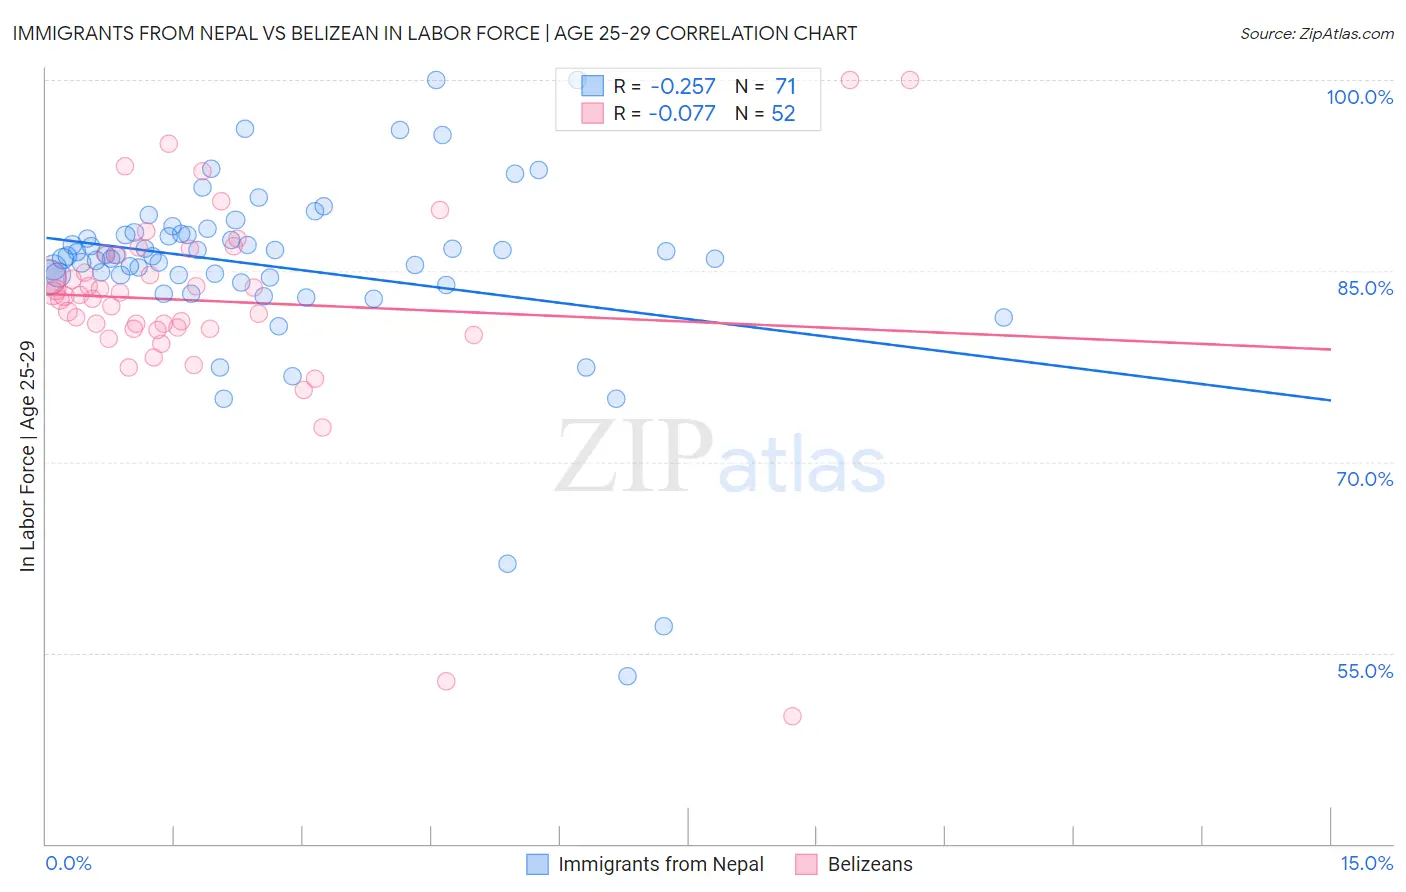
Immigrants from Nepal vs Belizean In Labor Force | Age 25-29 Correlation Chart
The statistical analysis conducted on geographies consisting of 186,763,083 people shows a weak negative correlation between the proportion of Immigrants from Nepal and labor force participation rate among population between the ages 25 and 29 in the United States with a correlation coefficient (R) of -0.257 and weighted average of 85.8%. Similarly, the statistical analysis conducted on geographies consisting of 144,200,012 people shows a slight negative correlation between the proportion of Belizeans and labor force participation rate among population between the ages 25 and 29 in the United States with a correlation coefficient (R) of -0.077 and weighted average of 83.1%, a difference of 3.3%.
In Labor Force | Age 25-29 Correlation Summary
| Measurement | Immigrants from Nepal | Belizean |
| Minimum | 53.2% | 50.0% |
| Maximum | 100.0% | 100.0% |
| Range | 46.8% | 50.0% |
| Mean | 85.3% | 82.6% |
| Median | 86.2% | 83.1% |
| Interquartile 25% (IQ1) | 84.5% | 80.5% |
| Interquartile 75% (IQ3) | 87.9% | 86.3% |
| Interquartile Range (IQR) | 3.4% | 5.8% |
| Standard Deviation (Sample) | 7.6% | 8.3% |
| Standard Deviation (Population) | 7.5% | 8.2% |
Similar Demographics by In Labor Force | Age 25-29
Demographics Similar to Immigrants from Nepal by In Labor Force | Age 25-29
In terms of in labor force | age 25-29, the demographic groups most similar to Immigrants from Nepal are Cypriot (85.8%, a difference of 0.0%), Lithuanian (85.8%, a difference of 0.010%), Polish (85.8%, a difference of 0.030%), Immigrants from Bulgaria (85.8%, a difference of 0.040%), and German Russian (85.8%, a difference of 0.050%).
| Demographics | Rating | Rank | In Labor Force | Age 25-29 |
| Immigrants | Liberia | 100.0 /100 | #29 | Exceptional 85.9% |
| Immigrants | Serbia | 100.0 /100 | #30 | Exceptional 85.9% |
| German Russians | 100.0 /100 | #31 | Exceptional 85.8% |
| Slovaks | 100.0 /100 | #32 | Exceptional 85.8% |
| Immigrants | Bulgaria | 100.0 /100 | #33 | Exceptional 85.8% |
| Lithuanians | 99.9 /100 | #34 | Exceptional 85.8% |
| Cypriots | 99.9 /100 | #35 | Exceptional 85.8% |
| Immigrants | Nepal | 99.9 /100 | #36 | Exceptional 85.8% |
| Poles | 99.9 /100 | #37 | Exceptional 85.8% |
| Sierra Leoneans | 99.9 /100 | #38 | Exceptional 85.8% |
| Croatians | 99.9 /100 | #39 | Exceptional 85.8% |
| Immigrants | Albania | 99.9 /100 | #40 | Exceptional 85.7% |
| Immigrants | Greece | 99.9 /100 | #41 | Exceptional 85.7% |
| Immigrants | Eritrea | 99.9 /100 | #42 | Exceptional 85.7% |
| Immigrants | India | 99.9 /100 | #43 | Exceptional 85.7% |
Demographics Similar to Belizeans by In Labor Force | Age 25-29
In terms of in labor force | age 25-29, the demographic groups most similar to Belizeans are Mexican American Indian (83.0%, a difference of 0.020%), Nicaraguan (83.1%, a difference of 0.030%), Guyanese (83.0%, a difference of 0.030%), American (83.1%, a difference of 0.060%), and Immigrants from the Azores (83.1%, a difference of 0.060%).
| Demographics | Rating | Rank | In Labor Force | Age 25-29 |
| Immigrants | Cuba | 0.0 /100 | #278 | Tragic 83.2% |
| British West Indians | 0.0 /100 | #279 | Tragic 83.2% |
| Dominicans | 0.0 /100 | #280 | Tragic 83.2% |
| Immigrants | Dominican Republic | 0.0 /100 | #281 | Tragic 83.1% |
| Americans | 0.0 /100 | #282 | Tragic 83.1% |
| Immigrants | Azores | 0.0 /100 | #283 | Tragic 83.1% |
| Nicaraguans | 0.0 /100 | #284 | Tragic 83.1% |
| Belizeans | 0.0 /100 | #285 | Tragic 83.1% |
| Mexican American Indians | 0.0 /100 | #286 | Tragic 83.0% |
| Guyanese | 0.0 /100 | #287 | Tragic 83.0% |
| Ottawa | 0.0 /100 | #288 | Tragic 83.0% |
| Immigrants | Micronesia | 0.0 /100 | #289 | Tragic 83.0% |
| Immigrants | Bangladesh | 0.0 /100 | #290 | Tragic 83.0% |
| Hawaiians | 0.0 /100 | #291 | Tragic 83.0% |
| Immigrants | Guyana | 0.0 /100 | #292 | Tragic 83.0% |