Immigrants from Western Africa vs Belizean Ambulatory Disability
COMPARE
Immigrants from Western Africa
Belizean
Ambulatory Disability
Ambulatory Disability Comparison
Immigrants from Western Africa
Belizeans
6.2%
AMBULATORY DISABILITY
33.4/ 100
METRIC RATING
190th/ 347
METRIC RANK
6.5%
AMBULATORY DISABILITY
0.7/ 100
METRIC RATING
254th/ 347
METRIC RANK
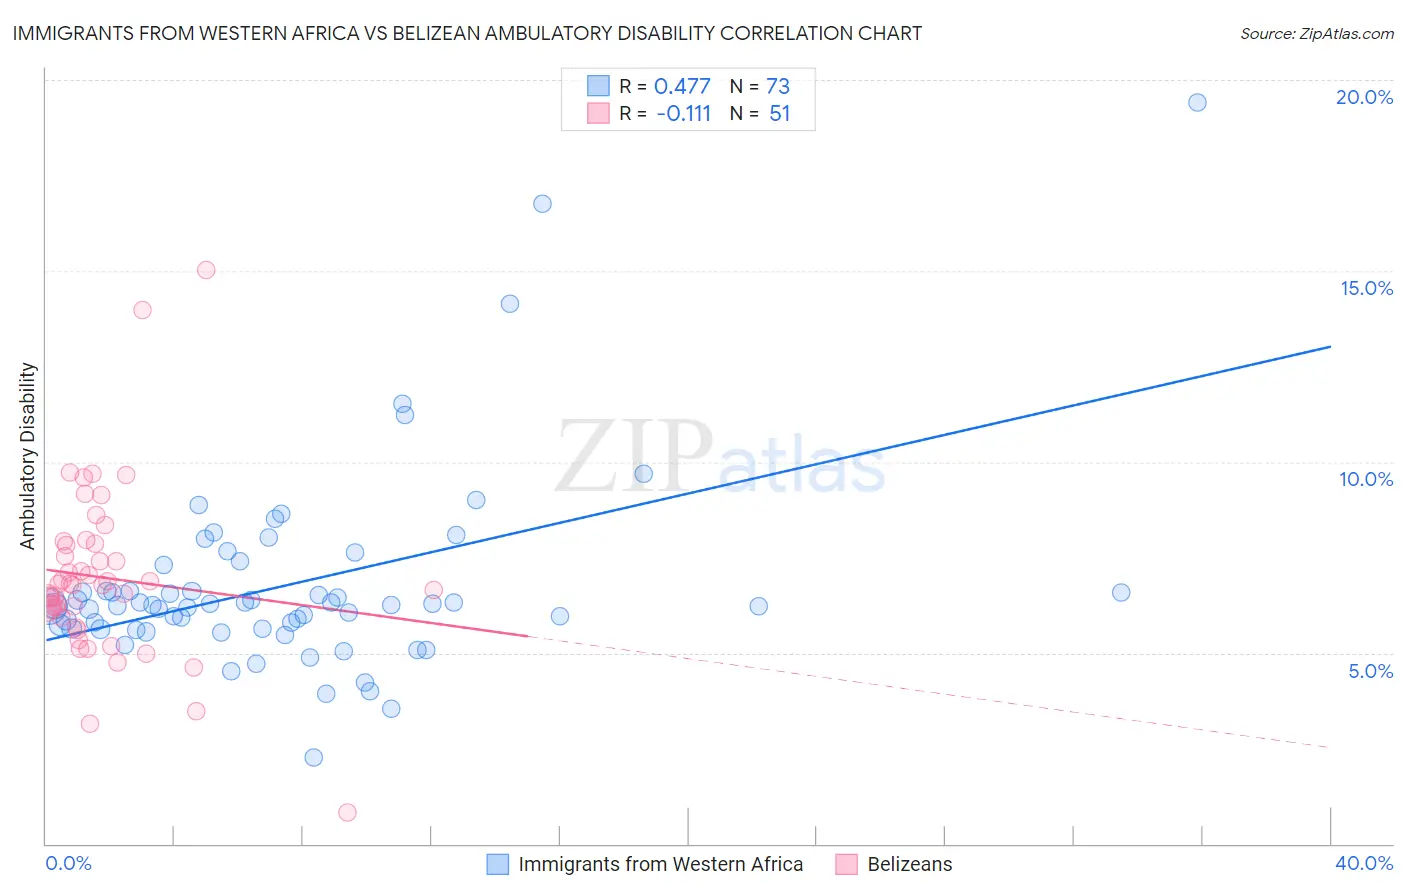
Immigrants from Western Africa vs Belizean Ambulatory Disability Correlation Chart
The statistical analysis conducted on geographies consisting of 357,681,039 people shows a moderate positive correlation between the proportion of Immigrants from Western Africa and percentage of population with ambulatory disability in the United States with a correlation coefficient (R) of 0.477 and weighted average of 6.2%. Similarly, the statistical analysis conducted on geographies consisting of 144,187,232 people shows a poor negative correlation between the proportion of Belizeans and percentage of population with ambulatory disability in the United States with a correlation coefficient (R) of -0.111 and weighted average of 6.5%, a difference of 5.7%.
Ambulatory Disability Correlation Summary
| Measurement | Immigrants from Western Africa | Belizean |
| Minimum | 2.3% | 0.81% |
| Maximum | 19.4% | 15.0% |
| Range | 17.2% | 14.2% |
| Mean | 6.8% | 7.0% |
| Median | 6.2% | 6.8% |
| Interquartile 25% (IQ1) | 5.6% | 5.9% |
| Interquartile 75% (IQ3) | 7.0% | 7.9% |
| Interquartile Range (IQR) | 1.3% | 1.9% |
| Standard Deviation (Sample) | 2.6% | 2.3% |
| Standard Deviation (Population) | 2.6% | 2.3% |
Similar Demographics by Ambulatory Disability
Demographics Similar to Immigrants from Western Africa by Ambulatory Disability
In terms of ambulatory disability, the demographic groups most similar to Immigrants from Western Africa are Ukrainian (6.2%, a difference of 0.040%), British (6.2%, a difference of 0.050%), Immigrants from Guatemala (6.2%, a difference of 0.090%), Immigrants from Western Europe (6.2%, a difference of 0.10%), and Carpatho Rusyn (6.2%, a difference of 0.12%).
| Demographics | Rating | Rank | Ambulatory Disability |
| Immigrants | Thailand | 42.2 /100 | #183 | Average 6.1% |
| Immigrants | Ghana | 41.2 /100 | #184 | Average 6.1% |
| Immigrants | Bosnia and Herzegovina | 37.2 /100 | #185 | Fair 6.2% |
| Europeans | 36.2 /100 | #186 | Fair 6.2% |
| Carpatho Rusyns | 35.3 /100 | #187 | Fair 6.2% |
| British | 34.3 /100 | #188 | Fair 6.2% |
| Ukrainians | 34.0 /100 | #189 | Fair 6.2% |
| Immigrants | Western Africa | 33.4 /100 | #190 | Fair 6.2% |
| Immigrants | Guatemala | 31.9 /100 | #191 | Fair 6.2% |
| Immigrants | Western Europe | 31.6 /100 | #192 | Fair 6.2% |
| Guatemalans | 30.0 /100 | #193 | Fair 6.2% |
| Alaska Natives | 29.8 /100 | #194 | Fair 6.2% |
| Belgians | 28.6 /100 | #195 | Fair 6.2% |
| Malaysians | 28.2 /100 | #196 | Fair 6.2% |
| Poles | 26.3 /100 | #197 | Fair 6.2% |
Demographics Similar to Belizeans by Ambulatory Disability
In terms of ambulatory disability, the demographic groups most similar to Belizeans are Welsh (6.5%, a difference of 0.070%), Immigrants from Uzbekistan (6.5%, a difference of 0.15%), Scottish (6.5%, a difference of 0.16%), Immigrants from Bahamas (6.5%, a difference of 0.21%), and Bermudan (6.5%, a difference of 0.23%).
| Demographics | Rating | Rank | Ambulatory Disability |
| Immigrants | Cuba | 1.4 /100 | #247 | Tragic 6.5% |
| Immigrants | Portugal | 1.4 /100 | #248 | Tragic 6.5% |
| Native Hawaiians | 1.1 /100 | #249 | Tragic 6.5% |
| Chinese | 1.0 /100 | #250 | Tragic 6.5% |
| Hawaiians | 0.9 /100 | #251 | Tragic 6.5% |
| Immigrants | Bahamas | 0.8 /100 | #252 | Tragic 6.5% |
| Scottish | 0.7 /100 | #253 | Tragic 6.5% |
| Belizeans | 0.7 /100 | #254 | Tragic 6.5% |
| Welsh | 0.6 /100 | #255 | Tragic 6.5% |
| Immigrants | Uzbekistan | 0.6 /100 | #256 | Tragic 6.5% |
| Bermudans | 0.5 /100 | #257 | Tragic 6.5% |
| Spanish American Indians | 0.5 /100 | #258 | Tragic 6.5% |
| Aleuts | 0.4 /100 | #259 | Tragic 6.6% |
| Immigrants | Belize | 0.4 /100 | #260 | Tragic 6.6% |
| Irish | 0.4 /100 | #261 | Tragic 6.6% |