Immigrants from Morocco vs Ukrainian Disability
COMPARE
Immigrants from Morocco
Ukrainian
Disability
Disability Comparison
Immigrants from Morocco
Ukrainians
11.2%
DISABILITY
97.8/ 100
METRIC RATING
94th/ 347
METRIC RANK
11.9%
DISABILITY
14.7/ 100
METRIC RATING
198th/ 347
METRIC RANK
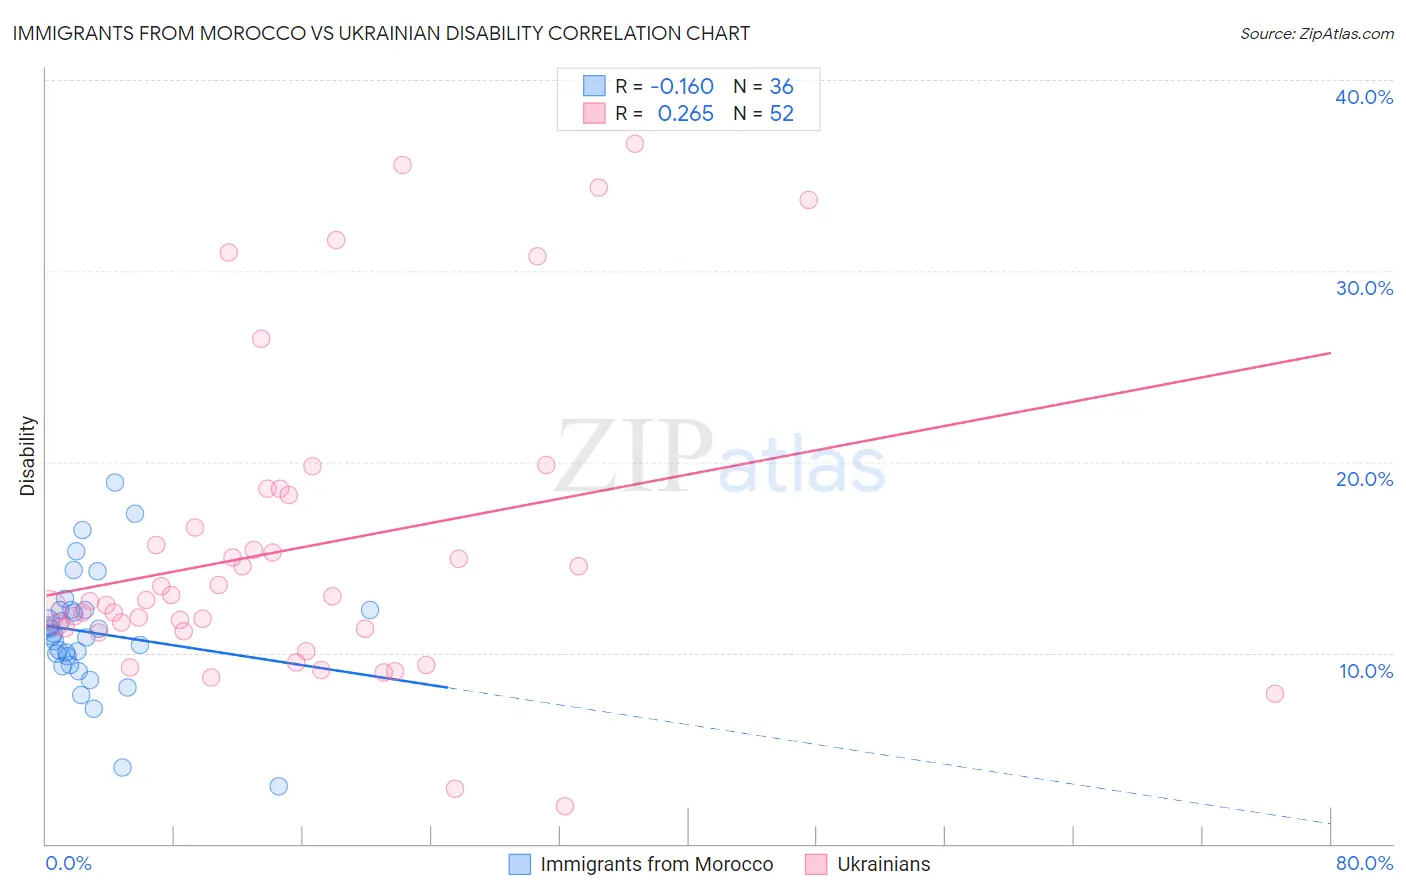
Immigrants from Morocco vs Ukrainian Disability Correlation Chart
The statistical analysis conducted on geographies consisting of 178,910,463 people shows a poor negative correlation between the proportion of Immigrants from Morocco and percentage of population with a disability in the United States with a correlation coefficient (R) of -0.160 and weighted average of 11.2%. Similarly, the statistical analysis conducted on geographies consisting of 448,640,628 people shows a weak positive correlation between the proportion of Ukrainians and percentage of population with a disability in the United States with a correlation coefficient (R) of 0.265 and weighted average of 11.9%, a difference of 6.4%.
Disability Correlation Summary
| Measurement | Immigrants from Morocco | Ukrainian |
| Minimum | 3.0% | 1.9% |
| Maximum | 18.9% | 36.7% |
| Range | 15.9% | 34.7% |
| Mean | 11.0% | 15.5% |
| Median | 10.9% | 12.7% |
| Interquartile 25% (IQ1) | 9.6% | 11.2% |
| Interquartile 75% (IQ3) | 12.2% | 17.4% |
| Interquartile Range (IQR) | 2.7% | 6.2% |
| Standard Deviation (Sample) | 3.2% | 8.2% |
| Standard Deviation (Population) | 3.1% | 8.1% |
Similar Demographics by Disability
Demographics Similar to Immigrants from Morocco by Disability
In terms of disability, the demographic groups most similar to Immigrants from Morocco are Eastern European (11.2%, a difference of 0.010%), Immigrants from Zimbabwe (11.2%, a difference of 0.070%), Ecuadorian (11.2%, a difference of 0.12%), Immigrants from Ecuador (11.2%, a difference of 0.12%), and Immigrants from Western Asia (11.2%, a difference of 0.16%).
| Demographics | Rating | Rank | Disability |
| Palestinians | 98.9 /100 | #87 | Exceptional 11.1% |
| Immigrants | Romania | 98.5 /100 | #88 | Exceptional 11.2% |
| Immigrants | South Africa | 98.2 /100 | #89 | Exceptional 11.2% |
| Immigrants | Brazil | 98.1 /100 | #90 | Exceptional 11.2% |
| Immigrants | Western Asia | 98.1 /100 | #91 | Exceptional 11.2% |
| Ecuadorians | 98.0 /100 | #92 | Exceptional 11.2% |
| Immigrants | Ecuador | 98.0 /100 | #93 | Exceptional 11.2% |
| Immigrants | Morocco | 97.8 /100 | #94 | Exceptional 11.2% |
| Eastern Europeans | 97.8 /100 | #95 | Exceptional 11.2% |
| Immigrants | Zimbabwe | 97.7 /100 | #96 | Exceptional 11.2% |
| Bhutanese | 97.4 /100 | #97 | Exceptional 11.2% |
| Uruguayans | 97.4 /100 | #98 | Exceptional 11.2% |
| Immigrants | Czechoslovakia | 97.4 /100 | #99 | Exceptional 11.2% |
| Immigrants | Greece | 96.9 /100 | #100 | Exceptional 11.3% |
| Immigrants | Nicaragua | 96.8 /100 | #101 | Exceptional 11.3% |
Demographics Similar to Ukrainians by Disability
In terms of disability, the demographic groups most similar to Ukrainians are Immigrants from Panama (11.9%, a difference of 0.010%), Immigrants from Belize (11.9%, a difference of 0.050%), Serbian (11.9%, a difference of 0.060%), Barbadian (11.9%, a difference of 0.10%), and Belizean (11.9%, a difference of 0.17%).
| Demographics | Rating | Rank | Disability |
| Ute | 19.5 /100 | #191 | Poor 11.9% |
| Lithuanians | 18.8 /100 | #192 | Poor 11.9% |
| Immigrants | Bosnia and Herzegovina | 18.0 /100 | #193 | Poor 11.9% |
| Somalis | 17.3 /100 | #194 | Poor 11.9% |
| Barbadians | 15.8 /100 | #195 | Poor 11.9% |
| Serbians | 15.4 /100 | #196 | Poor 11.9% |
| Immigrants | Belize | 15.2 /100 | #197 | Poor 11.9% |
| Ukrainians | 14.7 /100 | #198 | Poor 11.9% |
| Immigrants | Panama | 14.6 /100 | #199 | Poor 11.9% |
| Belizeans | 12.8 /100 | #200 | Poor 11.9% |
| Assyrians/Chaldeans/Syriacs | 12.6 /100 | #201 | Poor 11.9% |
| Immigrants | England | 12.0 /100 | #202 | Poor 12.0% |
| British West Indians | 11.5 /100 | #203 | Poor 12.0% |
| Mexican American Indians | 11.4 /100 | #204 | Poor 12.0% |
| Immigrants | Western Europe | 10.1 /100 | #205 | Poor 12.0% |