Immigrants from Moldova vs Immigrants from Japan Hearing Disability
COMPARE
Immigrants from Moldova
Immigrants from Japan
Hearing Disability
Hearing Disability Comparison
Immigrants from Moldova
Immigrants from Japan
3.0%
HEARING DISABILITY
43.1/ 100
METRIC RATING
179th/ 347
METRIC RANK
2.9%
HEARING DISABILITY
66.3/ 100
METRIC RATING
162nd/ 347
METRIC RANK
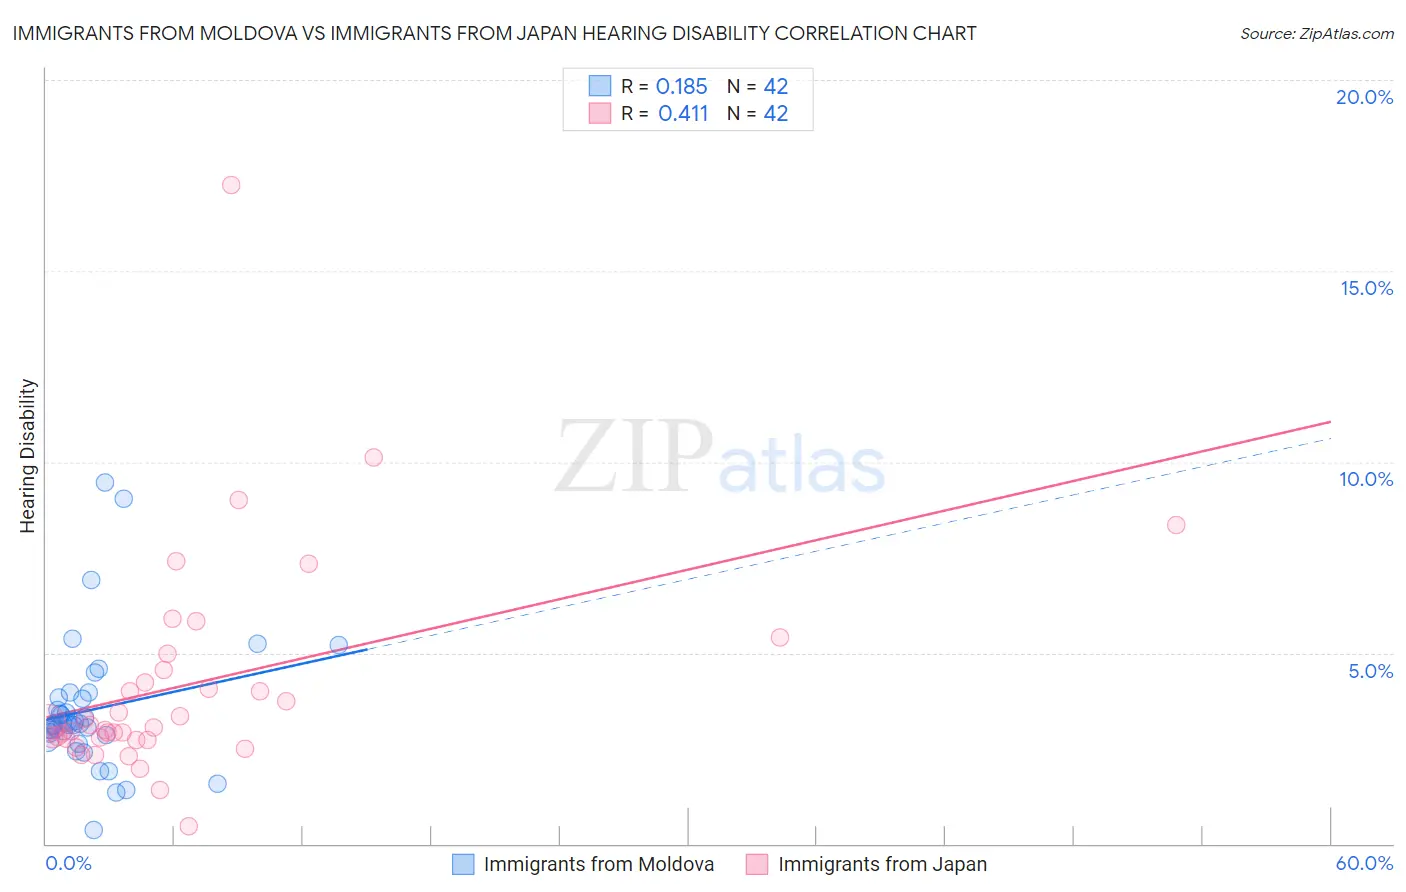
Immigrants from Moldova vs Immigrants from Japan Hearing Disability Correlation Chart
The statistical analysis conducted on geographies consisting of 124,366,720 people shows a poor positive correlation between the proportion of Immigrants from Moldova and percentage of population with hearing disability in the United States with a correlation coefficient (R) of 0.185 and weighted average of 3.0%. Similarly, the statistical analysis conducted on geographies consisting of 340,074,925 people shows a moderate positive correlation between the proportion of Immigrants from Japan and percentage of population with hearing disability in the United States with a correlation coefficient (R) of 0.411 and weighted average of 2.9%, a difference of 2.3%.
Hearing Disability Correlation Summary
| Measurement | Immigrants from Moldova | Immigrants from Japan |
| Minimum | 0.37% | 0.47% |
| Maximum | 9.5% | 17.2% |
| Range | 9.1% | 16.8% |
| Mean | 3.5% | 4.2% |
| Median | 3.1% | 3.1% |
| Interquartile 25% (IQ1) | 2.9% | 2.7% |
| Interquartile 75% (IQ3) | 3.8% | 4.6% |
| Interquartile Range (IQR) | 0.98% | 1.8% |
| Standard Deviation (Sample) | 1.7% | 2.9% |
| Standard Deviation (Population) | 1.7% | 2.9% |
Demographics Similar to Immigrants from Moldova and Immigrants from Japan by Hearing Disability
In terms of hearing disability, the demographic groups most similar to Immigrants from Moldova are Immigrants from Sweden (3.0%, a difference of 0.060%), Japanese (3.0%, a difference of 0.28%), Immigrants from Philippines (3.0%, a difference of 0.31%), Panamanian (3.0%, a difference of 0.37%), and Immigrants from Romania (3.0%, a difference of 0.51%). Similarly, the demographic groups most similar to Immigrants from Japan are Albanian (2.9%, a difference of 0.030%), Immigrants from Fiji (2.9%, a difference of 0.090%), Immigrants from Central America (3.0%, a difference of 0.15%), Immigrants from Cambodia (3.0%, a difference of 0.16%), and Immigrants from Zimbabwe (3.0%, a difference of 0.22%).
| Demographics | Rating | Rank | Hearing Disability |
| Immigrants | Fiji | 67.1 /100 | #160 | Good 2.9% |
| Albanians | 66.6 /100 | #161 | Good 2.9% |
| Immigrants | Japan | 66.3 /100 | #162 | Good 2.9% |
| Immigrants | Central America | 64.9 /100 | #163 | Good 3.0% |
| Immigrants | Cambodia | 64.8 /100 | #164 | Good 3.0% |
| Immigrants | Zimbabwe | 64.2 /100 | #165 | Good 3.0% |
| Immigrants | South Eastern Asia | 62.9 /100 | #166 | Good 3.0% |
| Immigrants | Eastern Europe | 58.1 /100 | #167 | Average 3.0% |
| Immigrants | Greece | 57.9 /100 | #168 | Average 3.0% |
| Arabs | 57.6 /100 | #169 | Average 3.0% |
| Immigrants | Cabo Verde | 56.9 /100 | #170 | Average 3.0% |
| Immigrants | Ukraine | 56.6 /100 | #171 | Average 3.0% |
| Armenians | 56.0 /100 | #172 | Average 3.0% |
| Immigrants | Serbia | 51.1 /100 | #173 | Average 3.0% |
| Indonesians | 50.0 /100 | #174 | Average 3.0% |
| Immigrants | Romania | 48.4 /100 | #175 | Average 3.0% |
| Panamanians | 47.0 /100 | #176 | Average 3.0% |
| Immigrants | Philippines | 46.4 /100 | #177 | Average 3.0% |
| Japanese | 46.0 /100 | #178 | Average 3.0% |
| Immigrants | Moldova | 43.1 /100 | #179 | Average 3.0% |
| Immigrants | Sweden | 42.4 /100 | #180 | Average 3.0% |