Navajo vs Immigrants from Japan Hearing Disability
COMPARE
Navajo
Immigrants from Japan
Hearing Disability
Hearing Disability Comparison
Navajo
Immigrants from Japan
4.6%
HEARING DISABILITY
0.0/ 100
METRIC RATING
341st/ 347
METRIC RANK
2.9%
HEARING DISABILITY
66.3/ 100
METRIC RATING
162nd/ 347
METRIC RANK
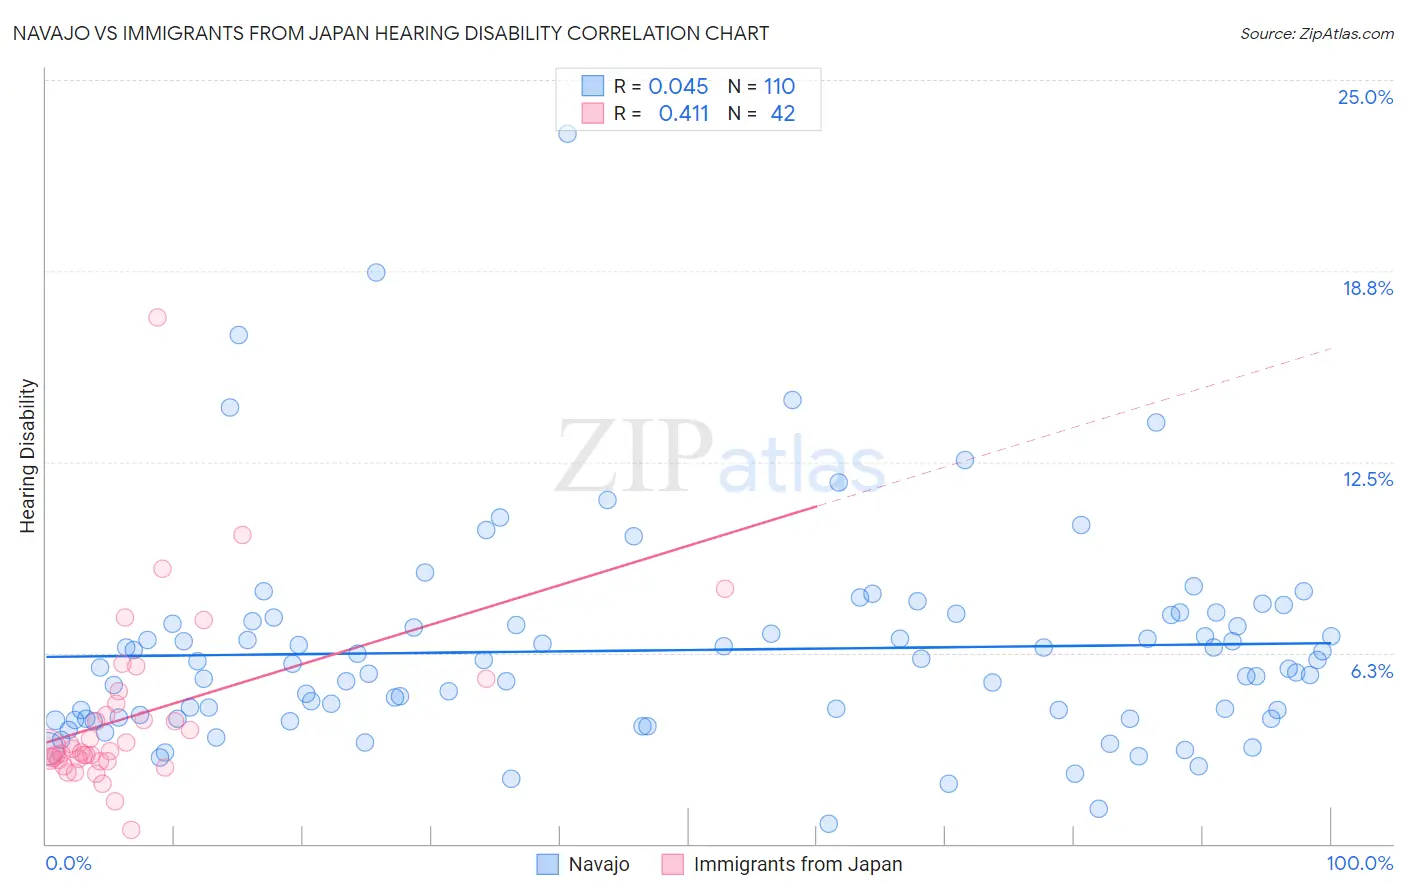
Navajo vs Immigrants from Japan Hearing Disability Correlation Chart
The statistical analysis conducted on geographies consisting of 224,724,902 people shows no correlation between the proportion of Navajo and percentage of population with hearing disability in the United States with a correlation coefficient (R) of 0.045 and weighted average of 4.6%. Similarly, the statistical analysis conducted on geographies consisting of 340,074,925 people shows a moderate positive correlation between the proportion of Immigrants from Japan and percentage of population with hearing disability in the United States with a correlation coefficient (R) of 0.411 and weighted average of 2.9%, a difference of 57.2%.
Hearing Disability Correlation Summary
| Measurement | Navajo | Immigrants from Japan |
| Minimum | 0.66% | 0.47% |
| Maximum | 23.2% | 17.2% |
| Range | 22.6% | 16.8% |
| Mean | 6.3% | 4.2% |
| Median | 5.8% | 3.1% |
| Interquartile 25% (IQ1) | 4.1% | 2.7% |
| Interquartile 75% (IQ3) | 7.3% | 4.6% |
| Interquartile Range (IQR) | 3.2% | 1.8% |
| Standard Deviation (Sample) | 3.4% | 2.9% |
| Standard Deviation (Population) | 3.4% | 2.9% |
Similar Demographics by Hearing Disability
Demographics Similar to Navajo by Hearing Disability
In terms of hearing disability, the demographic groups most similar to Navajo are Pueblo (4.6%, a difference of 0.33%), Tsimshian (4.7%, a difference of 1.5%), Inupiat (4.7%, a difference of 1.8%), Choctaw (4.5%, a difference of 1.8%), and Alaska Native (4.5%, a difference of 3.3%).
| Demographics | Rating | Rank | Hearing Disability |
| Dutch West Indians | 0.0 /100 | #333 | Tragic 4.3% |
| Aleuts | 0.0 /100 | #334 | Tragic 4.3% |
| Kiowa | 0.0 /100 | #335 | Tragic 4.3% |
| Creek | 0.0 /100 | #336 | Tragic 4.4% |
| Chickasaw | 0.0 /100 | #337 | Tragic 4.5% |
| Alaska Natives | 0.0 /100 | #338 | Tragic 4.5% |
| Choctaw | 0.0 /100 | #339 | Tragic 4.5% |
| Pueblo | 0.0 /100 | #340 | Tragic 4.6% |
| Navajo | 0.0 /100 | #341 | Tragic 4.6% |
| Tsimshian | 0.0 /100 | #342 | Tragic 4.7% |
| Inupiat | 0.0 /100 | #343 | Tragic 4.7% |
| Tlingit-Haida | 0.0 /100 | #344 | Tragic 4.8% |
| Alaskan Athabascans | 0.0 /100 | #345 | Tragic 5.3% |
| Colville | 0.0 /100 | #346 | Tragic 5.3% |
| Yup'ik | 0.0 /100 | #347 | Tragic 5.8% |
Demographics Similar to Immigrants from Japan by Hearing Disability
In terms of hearing disability, the demographic groups most similar to Immigrants from Japan are Albanian (2.9%, a difference of 0.030%), Immigrants from Fiji (2.9%, a difference of 0.090%), Immigrants from Australia (2.9%, a difference of 0.11%), Immigrants from Central America (3.0%, a difference of 0.15%), and Immigrants from Cambodia (3.0%, a difference of 0.16%).
| Demographics | Rating | Rank | Hearing Disability |
| Costa Ricans | 71.4 /100 | #155 | Good 2.9% |
| Immigrants | Poland | 70.2 /100 | #156 | Good 2.9% |
| Immigrants | Kazakhstan | 69.6 /100 | #157 | Good 2.9% |
| Immigrants | Burma/Myanmar | 69.5 /100 | #158 | Good 2.9% |
| Immigrants | Australia | 67.4 /100 | #159 | Good 2.9% |
| Immigrants | Fiji | 67.1 /100 | #160 | Good 2.9% |
| Albanians | 66.6 /100 | #161 | Good 2.9% |
| Immigrants | Japan | 66.3 /100 | #162 | Good 2.9% |
| Immigrants | Central America | 64.9 /100 | #163 | Good 3.0% |
| Immigrants | Cambodia | 64.8 /100 | #164 | Good 3.0% |
| Immigrants | Zimbabwe | 64.2 /100 | #165 | Good 3.0% |
| Immigrants | South Eastern Asia | 62.9 /100 | #166 | Good 3.0% |
| Immigrants | Eastern Europe | 58.1 /100 | #167 | Average 3.0% |
| Immigrants | Greece | 57.9 /100 | #168 | Average 3.0% |
| Arabs | 57.6 /100 | #169 | Average 3.0% |