Immigrants from Moldova vs Nicaraguan Hearing Disability
COMPARE
Immigrants from Moldova
Nicaraguan
Hearing Disability
Hearing Disability Comparison
Immigrants from Moldova
Nicaraguans
3.0%
HEARING DISABILITY
43.1/ 100
METRIC RATING
179th/ 347
METRIC RANK
2.7%
HEARING DISABILITY
97.9/ 100
METRIC RATING
69th/ 347
METRIC RANK
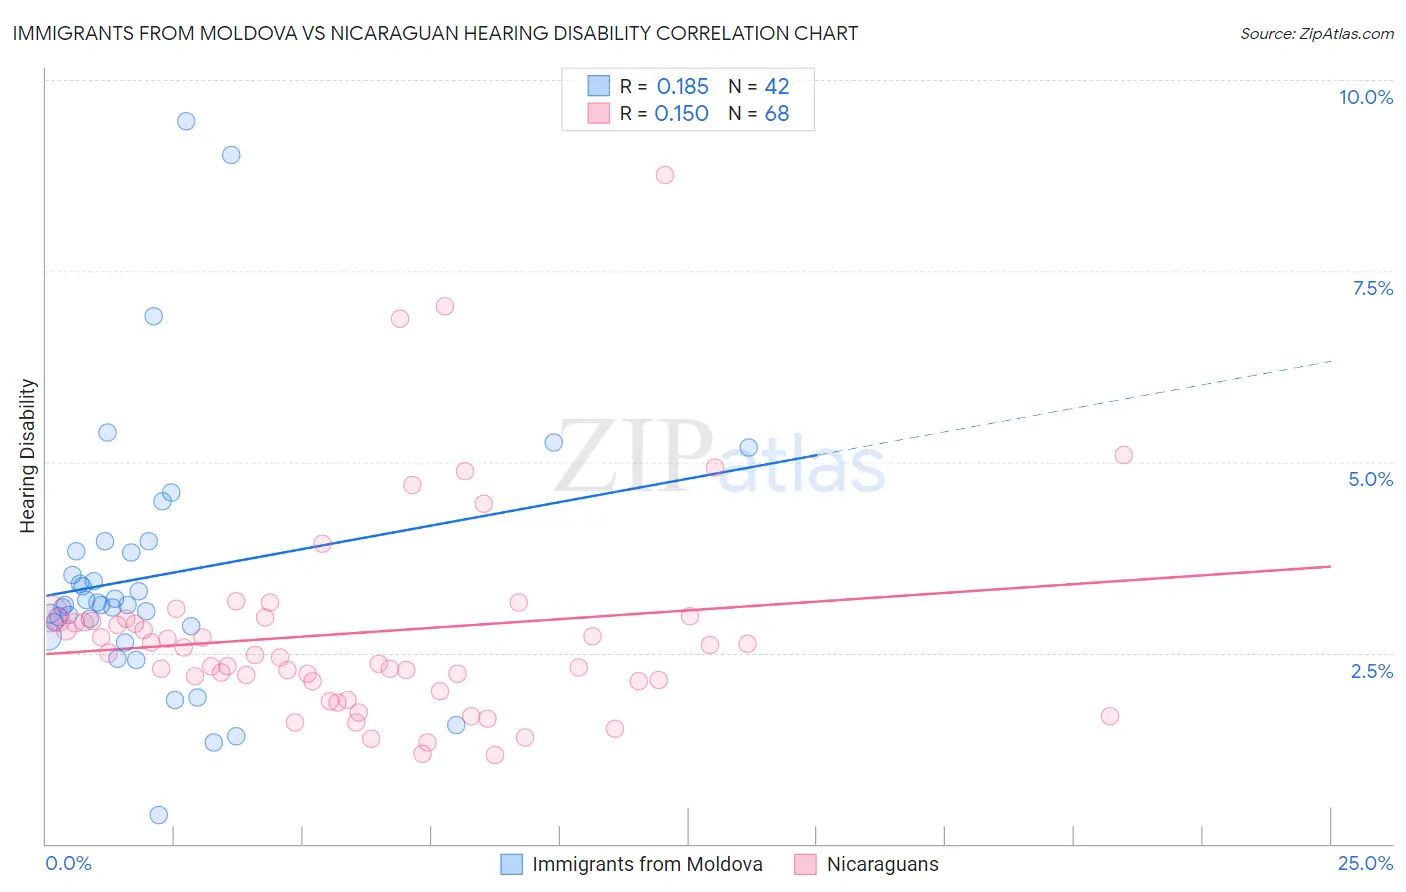
Immigrants from Moldova vs Nicaraguan Hearing Disability Correlation Chart
The statistical analysis conducted on geographies consisting of 124,366,720 people shows a poor positive correlation between the proportion of Immigrants from Moldova and percentage of population with hearing disability in the United States with a correlation coefficient (R) of 0.185 and weighted average of 3.0%. Similarly, the statistical analysis conducted on geographies consisting of 285,654,753 people shows a poor positive correlation between the proportion of Nicaraguans and percentage of population with hearing disability in the United States with a correlation coefficient (R) of 0.150 and weighted average of 2.7%, a difference of 10.7%.
Hearing Disability Correlation Summary
| Measurement | Immigrants from Moldova | Nicaraguan |
| Minimum | 0.37% | 1.2% |
| Maximum | 9.5% | 8.8% |
| Range | 9.1% | 7.6% |
| Mean | 3.5% | 2.8% |
| Median | 3.1% | 2.5% |
| Interquartile 25% (IQ1) | 2.9% | 2.1% |
| Interquartile 75% (IQ3) | 3.8% | 2.9% |
| Interquartile Range (IQR) | 0.98% | 0.81% |
| Standard Deviation (Sample) | 1.7% | 1.4% |
| Standard Deviation (Population) | 1.7% | 1.3% |
Similar Demographics by Hearing Disability
Demographics Similar to Immigrants from Moldova by Hearing Disability
In terms of hearing disability, the demographic groups most similar to Immigrants from Moldova are Immigrants from Sweden (3.0%, a difference of 0.060%), Immigrants from Belgium (3.0%, a difference of 0.15%), Immigrants from Italy (3.0%, a difference of 0.18%), Japanese (3.0%, a difference of 0.28%), and Immigrants from Philippines (3.0%, a difference of 0.31%).
| Demographics | Rating | Rank | Hearing Disability |
| Armenians | 56.0 /100 | #172 | Average 3.0% |
| Immigrants | Serbia | 51.1 /100 | #173 | Average 3.0% |
| Indonesians | 50.0 /100 | #174 | Average 3.0% |
| Immigrants | Romania | 48.4 /100 | #175 | Average 3.0% |
| Panamanians | 47.0 /100 | #176 | Average 3.0% |
| Immigrants | Philippines | 46.4 /100 | #177 | Average 3.0% |
| Japanese | 46.0 /100 | #178 | Average 3.0% |
| Immigrants | Moldova | 43.1 /100 | #179 | Average 3.0% |
| Immigrants | Sweden | 42.4 /100 | #180 | Average 3.0% |
| Immigrants | Belgium | 41.5 /100 | #181 | Average 3.0% |
| Immigrants | Italy | 41.1 /100 | #182 | Average 3.0% |
| Bulgarians | 39.7 /100 | #183 | Fair 3.0% |
| Immigrants | Ireland | 37.4 /100 | #184 | Fair 3.0% |
| Immigrants | Southern Europe | 35.3 /100 | #185 | Fair 3.0% |
| Immigrants | Mexico | 34.9 /100 | #186 | Fair 3.0% |
Demographics Similar to Nicaraguans by Hearing Disability
In terms of hearing disability, the demographic groups most similar to Nicaraguans are Immigrants from Africa (2.7%, a difference of 0.040%), Egyptian (2.7%, a difference of 0.17%), Peruvian (2.7%, a difference of 0.23%), Central American (2.7%, a difference of 0.28%), and Afghan (2.7%, a difference of 0.38%).
| Demographics | Rating | Rank | Hearing Disability |
| Immigrants | Colombia | 98.4 /100 | #62 | Exceptional 2.7% |
| Indians (Asian) | 98.4 /100 | #63 | Exceptional 2.7% |
| Immigrants | Sri Lanka | 98.4 /100 | #64 | Exceptional 2.7% |
| Immigrants | Nepal | 98.3 /100 | #65 | Exceptional 2.7% |
| Immigrants | Belize | 98.2 /100 | #66 | Exceptional 2.7% |
| Egyptians | 98.1 /100 | #67 | Exceptional 2.7% |
| Immigrants | Africa | 98.0 /100 | #68 | Exceptional 2.7% |
| Nicaraguans | 97.9 /100 | #69 | Exceptional 2.7% |
| Peruvians | 97.7 /100 | #70 | Exceptional 2.7% |
| Central Americans | 97.7 /100 | #71 | Exceptional 2.7% |
| Afghans | 97.6 /100 | #72 | Exceptional 2.7% |
| Argentineans | 97.5 /100 | #73 | Exceptional 2.7% |
| Immigrants | Korea | 97.5 /100 | #74 | Exceptional 2.7% |
| Immigrants | Saudi Arabia | 97.5 /100 | #75 | Exceptional 2.7% |
| Asians | 97.5 /100 | #76 | Exceptional 2.7% |