Immigrants from Moldova vs Pennsylvania German Hearing Disability
COMPARE
Immigrants from Moldova
Pennsylvania German
Hearing Disability
Hearing Disability Comparison
Immigrants from Moldova
Pennsylvania Germans
3.0%
HEARING DISABILITY
43.1/ 100
METRIC RATING
179th/ 347
METRIC RANK
3.7%
HEARING DISABILITY
0.0/ 100
METRIC RATING
301st/ 347
METRIC RANK
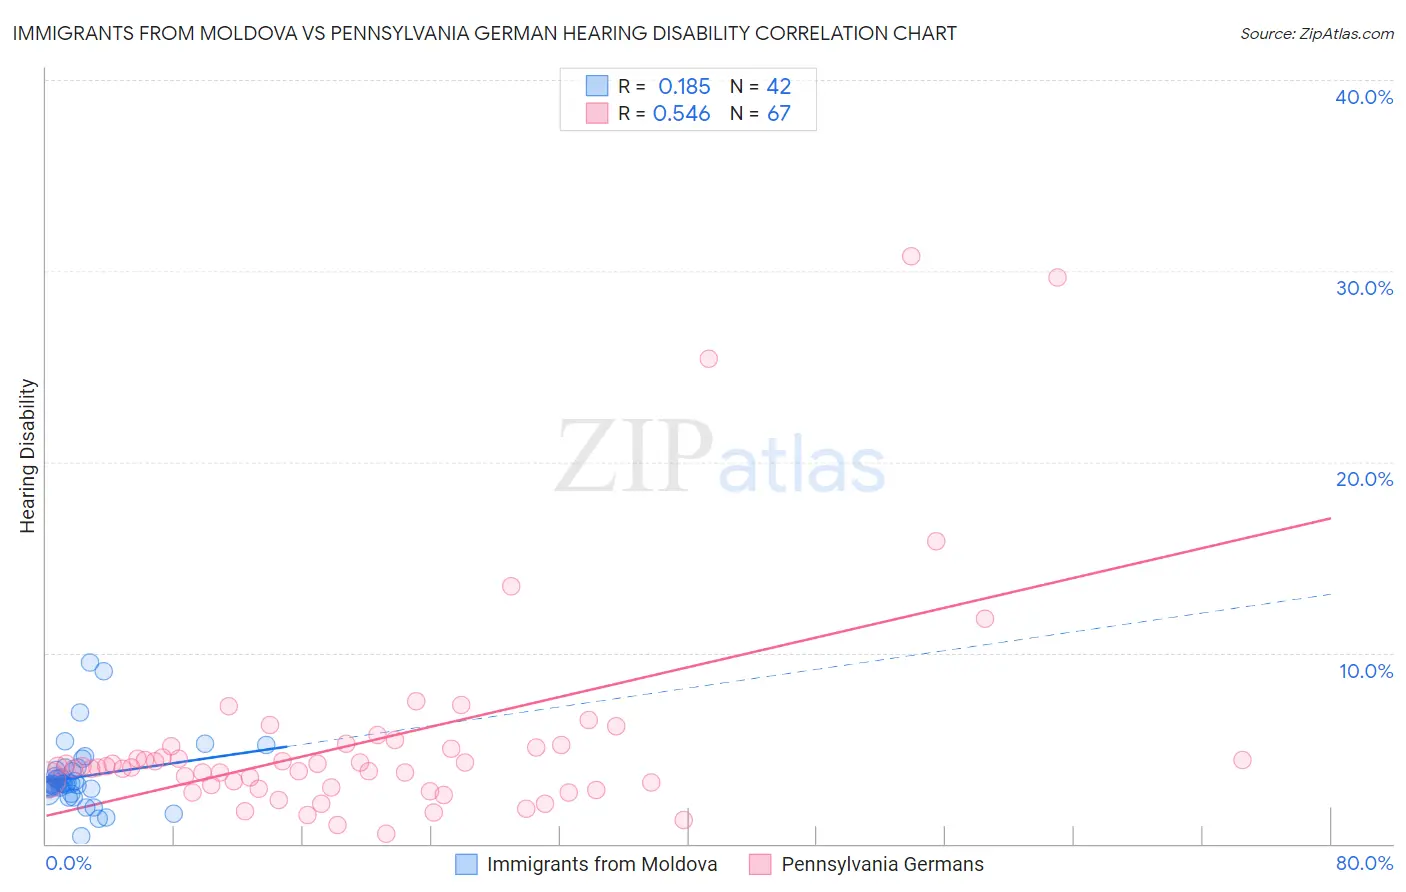
Immigrants from Moldova vs Pennsylvania German Hearing Disability Correlation Chart
The statistical analysis conducted on geographies consisting of 124,366,720 people shows a poor positive correlation between the proportion of Immigrants from Moldova and percentage of population with hearing disability in the United States with a correlation coefficient (R) of 0.185 and weighted average of 3.0%. Similarly, the statistical analysis conducted on geographies consisting of 234,065,533 people shows a substantial positive correlation between the proportion of Pennsylvania Germans and percentage of population with hearing disability in the United States with a correlation coefficient (R) of 0.546 and weighted average of 3.7%, a difference of 23.9%.
Hearing Disability Correlation Summary
| Measurement | Immigrants from Moldova | Pennsylvania German |
| Minimum | 0.37% | 0.51% |
| Maximum | 9.5% | 30.8% |
| Range | 9.1% | 30.3% |
| Mean | 3.5% | 5.4% |
| Median | 3.1% | 4.0% |
| Interquartile 25% (IQ1) | 2.9% | 3.0% |
| Interquartile 75% (IQ3) | 3.8% | 5.1% |
| Interquartile Range (IQR) | 0.98% | 2.1% |
| Standard Deviation (Sample) | 1.7% | 5.7% |
| Standard Deviation (Population) | 1.7% | 5.6% |
Similar Demographics by Hearing Disability
Demographics Similar to Immigrants from Moldova by Hearing Disability
In terms of hearing disability, the demographic groups most similar to Immigrants from Moldova are Immigrants from Sweden (3.0%, a difference of 0.060%), Immigrants from Belgium (3.0%, a difference of 0.15%), Immigrants from Italy (3.0%, a difference of 0.18%), Japanese (3.0%, a difference of 0.28%), and Immigrants from Philippines (3.0%, a difference of 0.31%).
| Demographics | Rating | Rank | Hearing Disability |
| Armenians | 56.0 /100 | #172 | Average 3.0% |
| Immigrants | Serbia | 51.1 /100 | #173 | Average 3.0% |
| Indonesians | 50.0 /100 | #174 | Average 3.0% |
| Immigrants | Romania | 48.4 /100 | #175 | Average 3.0% |
| Panamanians | 47.0 /100 | #176 | Average 3.0% |
| Immigrants | Philippines | 46.4 /100 | #177 | Average 3.0% |
| Japanese | 46.0 /100 | #178 | Average 3.0% |
| Immigrants | Moldova | 43.1 /100 | #179 | Average 3.0% |
| Immigrants | Sweden | 42.4 /100 | #180 | Average 3.0% |
| Immigrants | Belgium | 41.5 /100 | #181 | Average 3.0% |
| Immigrants | Italy | 41.1 /100 | #182 | Average 3.0% |
| Bulgarians | 39.7 /100 | #183 | Fair 3.0% |
| Immigrants | Ireland | 37.4 /100 | #184 | Fair 3.0% |
| Immigrants | Southern Europe | 35.3 /100 | #185 | Fair 3.0% |
| Immigrants | Mexico | 34.9 /100 | #186 | Fair 3.0% |
Demographics Similar to Pennsylvania Germans by Hearing Disability
In terms of hearing disability, the demographic groups most similar to Pennsylvania Germans are Scottish (3.7%, a difference of 0.030%), German (3.7%, a difference of 0.090%), Dutch (3.7%, a difference of 0.11%), Menominee (3.7%, a difference of 0.16%), and Celtic (3.7%, a difference of 0.37%).
| Demographics | Rating | Rank | Hearing Disability |
| Iroquois | 0.0 /100 | #294 | Tragic 3.7% |
| Welsh | 0.0 /100 | #295 | Tragic 3.7% |
| Pima | 0.0 /100 | #296 | Tragic 3.7% |
| Immigrants | Azores | 0.0 /100 | #297 | Tragic 3.7% |
| Celtics | 0.0 /100 | #298 | Tragic 3.7% |
| Germans | 0.0 /100 | #299 | Tragic 3.7% |
| Scottish | 0.0 /100 | #300 | Tragic 3.7% |
| Pennsylvania Germans | 0.0 /100 | #301 | Tragic 3.7% |
| Dutch | 0.0 /100 | #302 | Tragic 3.7% |
| Menominee | 0.0 /100 | #303 | Tragic 3.7% |
| French | 0.0 /100 | #304 | Tragic 3.8% |
| English | 0.0 /100 | #305 | Tragic 3.8% |
| Marshallese | 0.0 /100 | #306 | Tragic 3.8% |
| French Canadians | 0.0 /100 | #307 | Tragic 3.8% |
| Ottawa | 0.0 /100 | #308 | Tragic 3.8% |