Immigrants from Middle Africa vs Scottish Male Disability
COMPARE
Immigrants from Middle Africa
Scottish
Male Disability
Male Disability Comparison
Immigrants from Middle Africa
Scottish
11.1%
MALE DISABILITY
70.9/ 100
METRIC RATING
155th/ 347
METRIC RANK
12.8%
MALE DISABILITY
0.0/ 100
METRIC RATING
286th/ 347
METRIC RANK
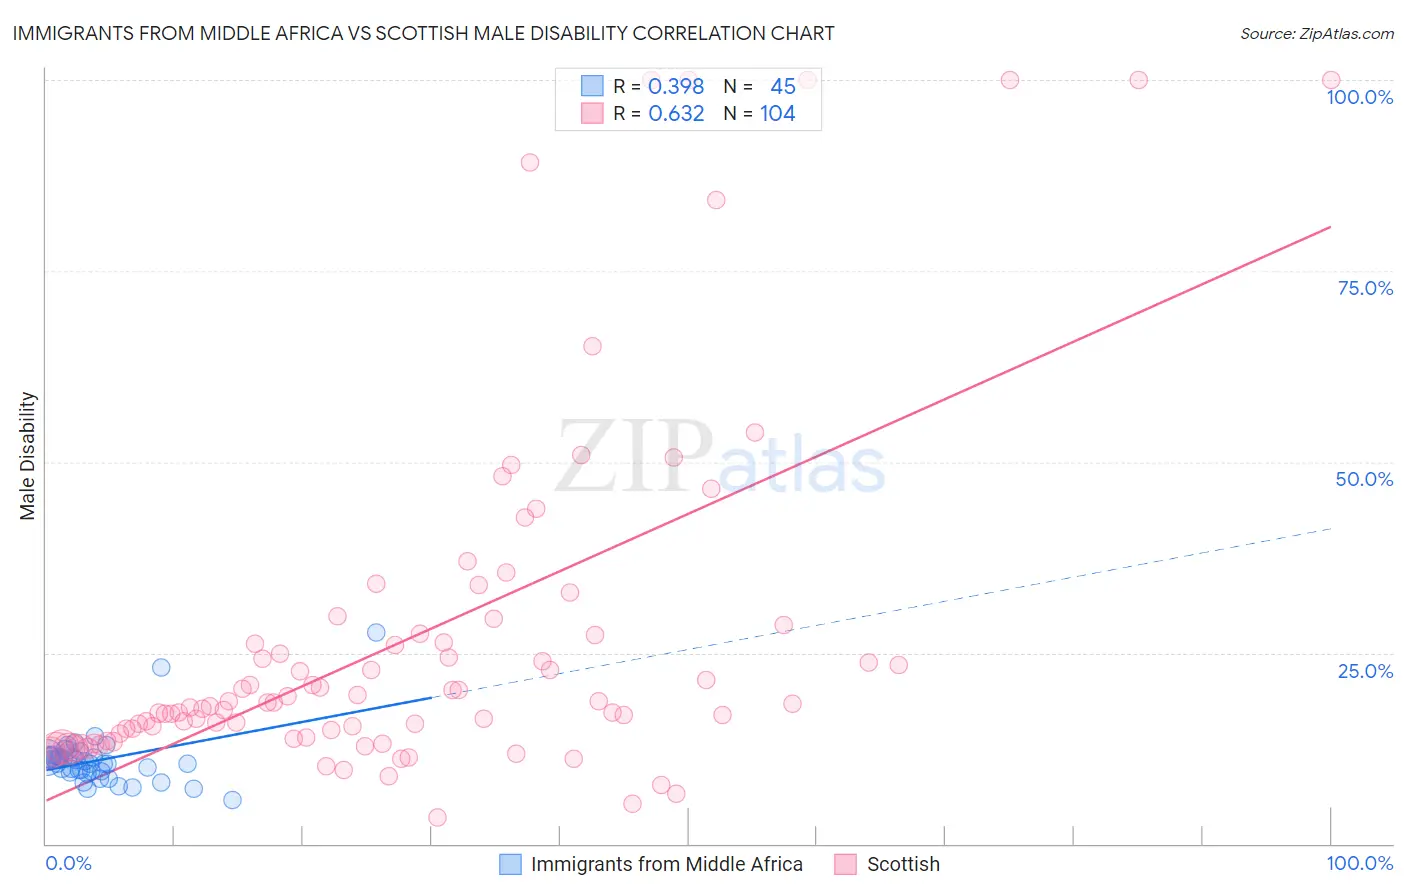
Immigrants from Middle Africa vs Scottish Male Disability Correlation Chart
The statistical analysis conducted on geographies consisting of 202,727,084 people shows a mild positive correlation between the proportion of Immigrants from Middle Africa and percentage of males with a disability in the United States with a correlation coefficient (R) of 0.398 and weighted average of 11.1%. Similarly, the statistical analysis conducted on geographies consisting of 566,868,484 people shows a significant positive correlation between the proportion of Scottish and percentage of males with a disability in the United States with a correlation coefficient (R) of 0.632 and weighted average of 12.8%, a difference of 15.1%.
Male Disability Correlation Summary
| Measurement | Immigrants from Middle Africa | Scottish |
| Minimum | 5.8% | 3.4% |
| Maximum | 27.6% | 100.0% |
| Range | 21.8% | 96.6% |
| Mean | 11.0% | 27.0% |
| Median | 10.5% | 18.4% |
| Interquartile 25% (IQ1) | 9.4% | 14.2% |
| Interquartile 75% (IQ3) | 11.3% | 27.4% |
| Interquartile Range (IQR) | 1.9% | 13.2% |
| Standard Deviation (Sample) | 3.6% | 23.1% |
| Standard Deviation (Population) | 3.6% | 23.0% |
Similar Demographics by Male Disability
Demographics Similar to Immigrants from Middle Africa by Male Disability
In terms of male disability, the demographic groups most similar to Immigrants from Middle Africa are Russian (11.1%, a difference of 0.070%), Immigrants from Western Africa (11.1%, a difference of 0.11%), Immigrants from Moldova (11.1%, a difference of 0.14%), Immigrants from Northern Europe (11.1%, a difference of 0.16%), and Latvian (11.1%, a difference of 0.18%).
| Demographics | Rating | Rank | Male Disability |
| Sudanese | 77.1 /100 | #148 | Good 11.0% |
| Immigrants | Denmark | 76.4 /100 | #149 | Good 11.0% |
| Immigrants | Guatemala | 75.1 /100 | #150 | Good 11.0% |
| Cubans | 74.9 /100 | #151 | Good 11.0% |
| Immigrants | Albania | 74.4 /100 | #152 | Good 11.0% |
| Immigrants | Northern Europe | 73.2 /100 | #153 | Good 11.1% |
| Immigrants | Moldova | 72.8 /100 | #154 | Good 11.1% |
| Immigrants | Middle Africa | 70.9 /100 | #155 | Good 11.1% |
| Russians | 69.8 /100 | #156 | Good 11.1% |
| Immigrants | Western Africa | 69.2 /100 | #157 | Good 11.1% |
| Latvians | 68.1 /100 | #158 | Good 11.1% |
| Guatemalans | 67.2 /100 | #159 | Good 11.1% |
| Albanians | 66.5 /100 | #160 | Good 11.1% |
| Immigrants | West Indies | 65.7 /100 | #161 | Good 11.1% |
| Immigrants | Haiti | 65.3 /100 | #162 | Good 11.1% |
Demographics Similar to Scottish by Male Disability
In terms of male disability, the demographic groups most similar to Scottish are Welsh (12.7%, a difference of 0.050%), Spanish (12.7%, a difference of 0.060%), Cape Verdean (12.8%, a difference of 0.070%), Yup'ik (12.8%, a difference of 0.26%), and German (12.7%, a difference of 0.32%).
| Demographics | Rating | Rank | Male Disability |
| Slovaks | 0.0 /100 | #279 | Tragic 12.7% |
| Dutch | 0.0 /100 | #280 | Tragic 12.7% |
| Sioux | 0.0 /100 | #281 | Tragic 12.7% |
| Irish | 0.0 /100 | #282 | Tragic 12.7% |
| Germans | 0.0 /100 | #283 | Tragic 12.7% |
| Spanish | 0.0 /100 | #284 | Tragic 12.7% |
| Welsh | 0.0 /100 | #285 | Tragic 12.7% |
| Scottish | 0.0 /100 | #286 | Tragic 12.8% |
| Cape Verdeans | 0.0 /100 | #287 | Tragic 12.8% |
| Yup'ik | 0.0 /100 | #288 | Tragic 12.8% |
| Immigrants | Cabo Verde | 0.0 /100 | #289 | Tragic 12.8% |
| Pima | 0.0 /100 | #290 | Tragic 12.8% |
| Whites/Caucasians | 0.0 /100 | #291 | Tragic 12.8% |
| English | 0.0 /100 | #292 | Tragic 12.8% |
| Yaqui | 0.0 /100 | #293 | Tragic 12.9% |