Immigrants from Lithuania vs Venezuelan Disability Age 5 to 17
COMPARE
Immigrants from Lithuania
Venezuelan
Disability Age 5 to 17
Disability Age 5 to 17 Comparison
Immigrants from Lithuania
Venezuelans
5.1%
DISABILITY AGE 5 TO 17
99.9/ 100
METRIC RATING
53rd/ 347
METRIC RANK
5.4%
DISABILITY AGE 5 TO 17
92.7/ 100
METRIC RATING
133rd/ 347
METRIC RANK
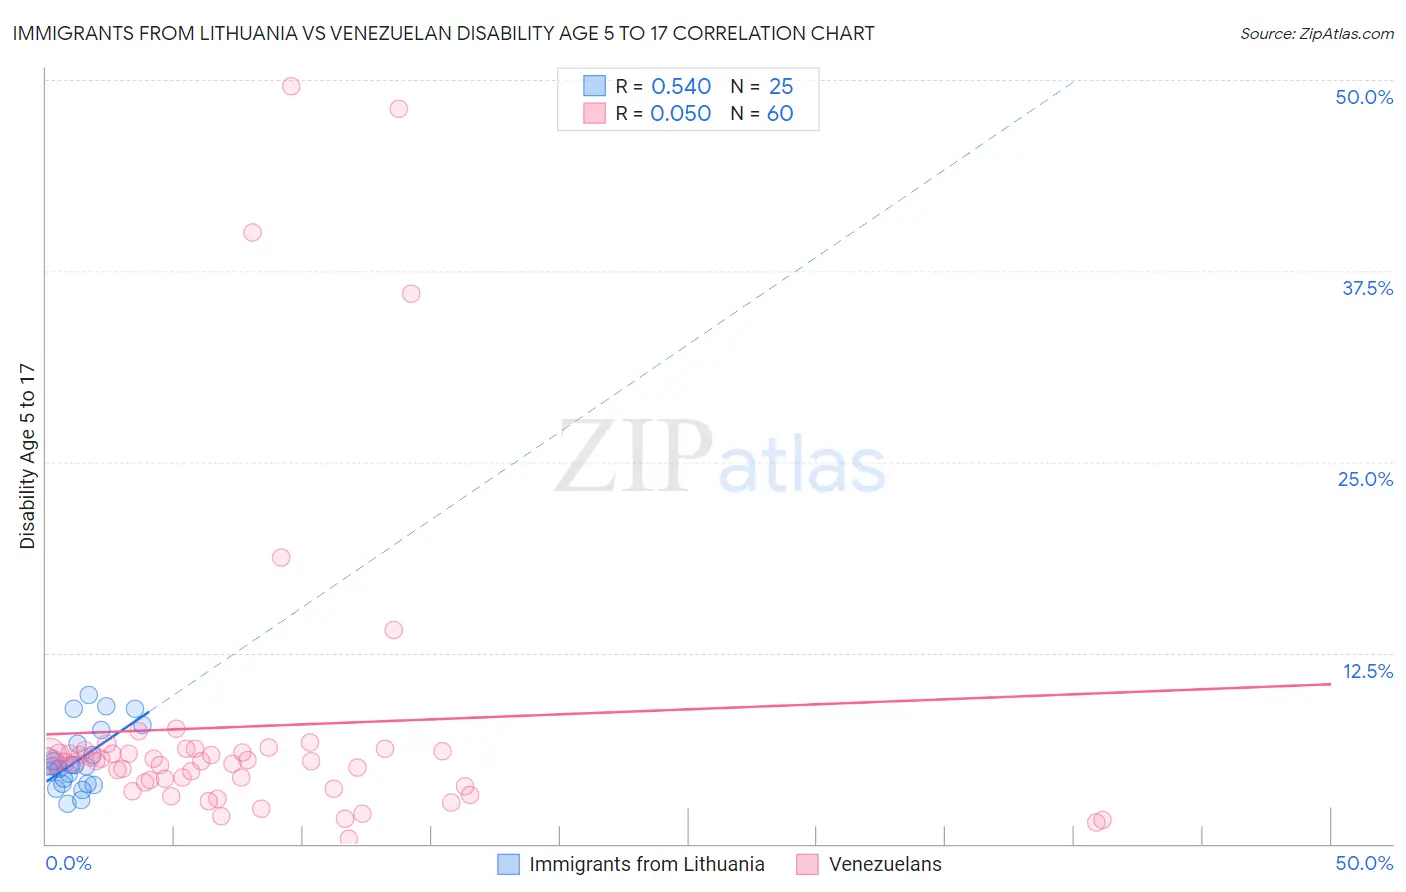
Immigrants from Lithuania vs Venezuelan Disability Age 5 to 17 Correlation Chart
The statistical analysis conducted on geographies consisting of 117,321,416 people shows a substantial positive correlation between the proportion of Immigrants from Lithuania and percentage of population with a disability between the ages 5 and 17 in the United States with a correlation coefficient (R) of 0.540 and weighted average of 5.1%. Similarly, the statistical analysis conducted on geographies consisting of 304,670,804 people shows no correlation between the proportion of Venezuelans and percentage of population with a disability between the ages 5 and 17 in the United States with a correlation coefficient (R) of 0.050 and weighted average of 5.4%, a difference of 6.2%.
Disability Age 5 to 17 Correlation Summary
| Measurement | Immigrants from Lithuania | Venezuelan |
| Minimum | 2.6% | 0.36% |
| Maximum | 9.7% | 49.6% |
| Range | 7.1% | 49.2% |
| Mean | 5.5% | 7.7% |
| Median | 5.1% | 5.4% |
| Interquartile 25% (IQ1) | 3.9% | 3.9% |
| Interquartile 75% (IQ3) | 7.0% | 6.1% |
| Interquartile Range (IQR) | 3.1% | 2.2% |
| Standard Deviation (Sample) | 2.0% | 10.1% |
| Standard Deviation (Population) | 2.0% | 10.0% |
Similar Demographics by Disability Age 5 to 17
Demographics Similar to Immigrants from Lithuania by Disability Age 5 to 17
In terms of disability age 5 to 17, the demographic groups most similar to Immigrants from Lithuania are Paraguayan (5.1%, a difference of 0.030%), Immigrants from Fiji (5.1%, a difference of 0.050%), Laotian (5.1%, a difference of 0.070%), Immigrants from Turkey (5.1%, a difference of 0.090%), and Turkish (5.1%, a difference of 0.14%).
| Demographics | Rating | Rank | Disability Age 5 to 17 |
| Assyrians/Chaldeans/Syriacs | 100.0 /100 | #46 | Exceptional 5.0% |
| Vietnamese | 100.0 /100 | #47 | Exceptional 5.1% |
| Koreans | 100.0 /100 | #48 | Exceptional 5.1% |
| Immigrants | Western Asia | 100.0 /100 | #49 | Exceptional 5.1% |
| Argentineans | 99.9 /100 | #50 | Exceptional 5.1% |
| Turks | 99.9 /100 | #51 | Exceptional 5.1% |
| Immigrants | Fiji | 99.9 /100 | #52 | Exceptional 5.1% |
| Immigrants | Lithuania | 99.9 /100 | #53 | Exceptional 5.1% |
| Paraguayans | 99.9 /100 | #54 | Exceptional 5.1% |
| Laotians | 99.9 /100 | #55 | Exceptional 5.1% |
| Immigrants | Turkey | 99.9 /100 | #56 | Exceptional 5.1% |
| Immigrants | Poland | 99.9 /100 | #57 | Exceptional 5.1% |
| Immigrants | Ukraine | 99.9 /100 | #58 | Exceptional 5.1% |
| Immigrants | North Macedonia | 99.9 /100 | #59 | Exceptional 5.1% |
| Immigrants | Eastern Europe | 99.9 /100 | #60 | Exceptional 5.1% |
Demographics Similar to Venezuelans by Disability Age 5 to 17
In terms of disability age 5 to 17, the demographic groups most similar to Venezuelans are Immigrants from Colombia (5.4%, a difference of 0.030%), Arab (5.4%, a difference of 0.050%), Yuman (5.4%, a difference of 0.080%), Immigrants from Belize (5.4%, a difference of 0.17%), and Immigrants from Denmark (5.4%, a difference of 0.22%).
| Demographics | Rating | Rank | Disability Age 5 to 17 |
| New Zealanders | 95.0 /100 | #126 | Exceptional 5.4% |
| Latvians | 95.0 /100 | #127 | Exceptional 5.4% |
| Immigrants | Venezuela | 94.5 /100 | #128 | Exceptional 5.4% |
| Romanians | 94.1 /100 | #129 | Exceptional 5.4% |
| Immigrants | Bulgaria | 94.0 /100 | #130 | Exceptional 5.4% |
| Arabs | 92.9 /100 | #131 | Exceptional 5.4% |
| Immigrants | Colombia | 92.9 /100 | #132 | Exceptional 5.4% |
| Venezuelans | 92.7 /100 | #133 | Exceptional 5.4% |
| Yuman | 92.3 /100 | #134 | Exceptional 5.4% |
| Immigrants | Belize | 91.7 /100 | #135 | Exceptional 5.4% |
| Immigrants | Denmark | 91.4 /100 | #136 | Exceptional 5.4% |
| Navajo | 90.9 /100 | #137 | Exceptional 5.4% |
| Immigrants | Oceania | 90.8 /100 | #138 | Exceptional 5.4% |
| Belizeans | 90.8 /100 | #139 | Exceptional 5.4% |
| Immigrants | Netherlands | 90.5 /100 | #140 | Exceptional 5.4% |