Immigrants from Lithuania vs Venezuelan 4th Grade
COMPARE
Immigrants from Lithuania
Venezuelan
4th Grade
4th Grade Comparison
Immigrants from Lithuania
Venezuelans
98.0%
4TH GRADE
99.3/ 100
METRIC RATING
77th/ 347
METRIC RANK
97.6%
4TH GRADE
58.7/ 100
METRIC RATING
165th/ 347
METRIC RANK
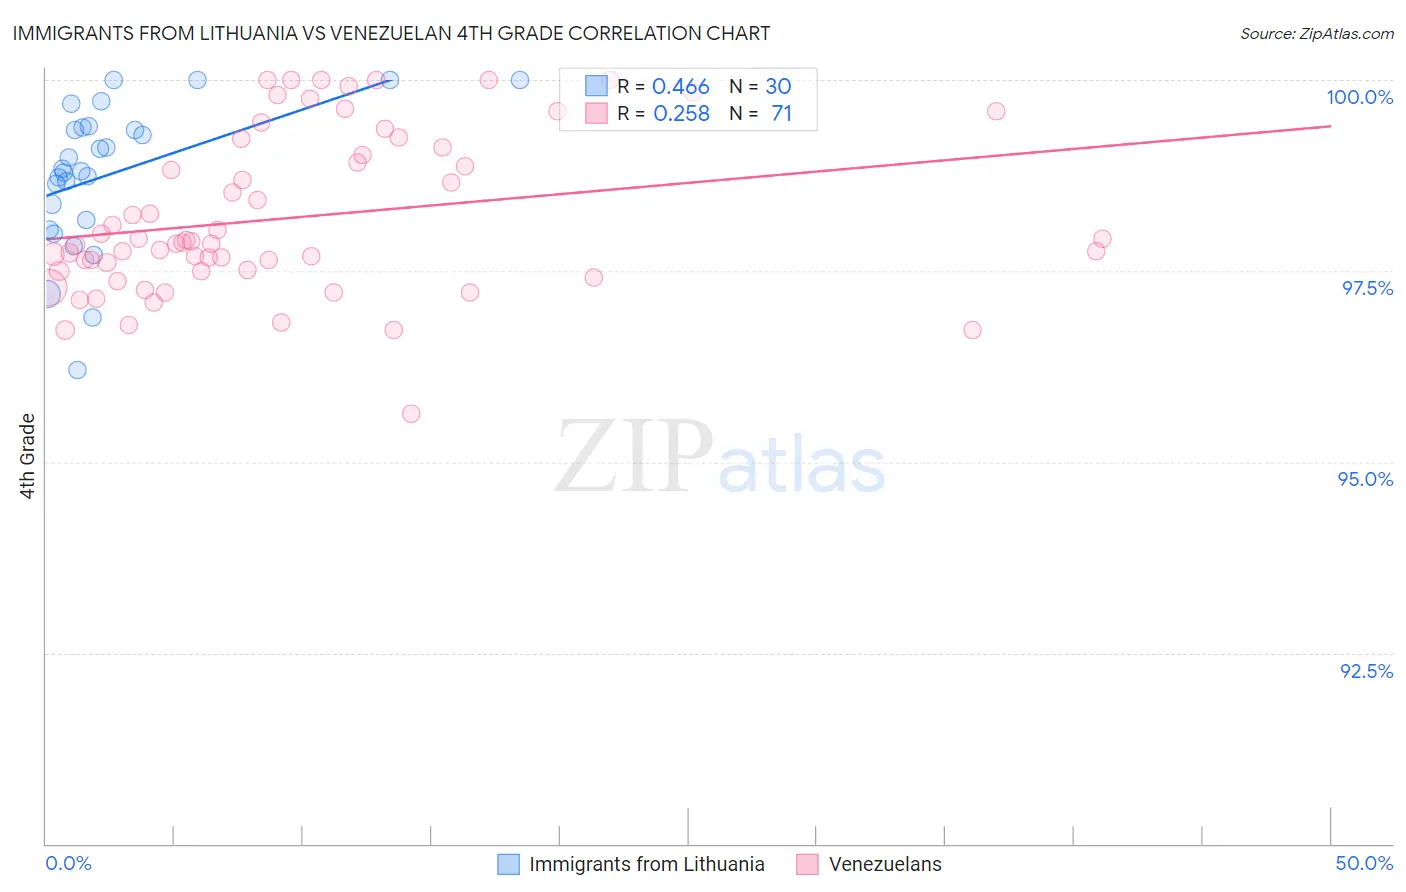
Immigrants from Lithuania vs Venezuelan 4th Grade Correlation Chart
The statistical analysis conducted on geographies consisting of 117,724,932 people shows a moderate positive correlation between the proportion of Immigrants from Lithuania and percentage of population with at least 4th grade education in the United States with a correlation coefficient (R) of 0.466 and weighted average of 98.0%. Similarly, the statistical analysis conducted on geographies consisting of 306,323,638 people shows a weak positive correlation between the proportion of Venezuelans and percentage of population with at least 4th grade education in the United States with a correlation coefficient (R) of 0.258 and weighted average of 97.6%, a difference of 0.43%.
4th Grade Correlation Summary
| Measurement | Immigrants from Lithuania | Venezuelan |
| Minimum | 96.2% | 95.6% |
| Maximum | 100.0% | 100.0% |
| Range | 3.8% | 4.4% |
| Mean | 98.8% | 98.2% |
| Median | 98.8% | 97.9% |
| Interquartile 25% (IQ1) | 98.2% | 97.5% |
| Interquartile 75% (IQ3) | 99.4% | 99.1% |
| Interquartile Range (IQR) | 1.2% | 1.6% |
| Standard Deviation (Sample) | 0.95% | 1.0% |
| Standard Deviation (Population) | 0.93% | 1.0% |
Similar Demographics by 4th Grade
Demographics Similar to Immigrants from Lithuania by 4th Grade
In terms of 4th grade, the demographic groups most similar to Immigrants from Lithuania are Immigrants from Netherlands (98.0%, a difference of 0.0%), Cherokee (98.0%, a difference of 0.0%), Immigrants from England (98.0%, a difference of 0.0%), Ukrainian (98.0%, a difference of 0.010%), and Osage (98.0%, a difference of 0.010%).
| Demographics | Rating | Rank | 4th Grade |
| Immigrants | Austria | 99.6 /100 | #70 | Exceptional 98.0% |
| Lumbee | 99.6 /100 | #71 | Exceptional 98.0% |
| Iranians | 99.4 /100 | #72 | Exceptional 98.0% |
| Macedonians | 99.4 /100 | #73 | Exceptional 98.0% |
| Chickasaw | 99.4 /100 | #74 | Exceptional 98.0% |
| Immigrants | Netherlands | 99.3 /100 | #75 | Exceptional 98.0% |
| Cherokee | 99.3 /100 | #76 | Exceptional 98.0% |
| Immigrants | Lithuania | 99.3 /100 | #77 | Exceptional 98.0% |
| Immigrants | England | 99.3 /100 | #78 | Exceptional 98.0% |
| Ukrainians | 99.2 /100 | #79 | Exceptional 98.0% |
| Osage | 99.2 /100 | #80 | Exceptional 98.0% |
| Immigrants | India | 99.1 /100 | #81 | Exceptional 98.0% |
| Icelanders | 99.1 /100 | #82 | Exceptional 98.0% |
| Immigrants | Belgium | 99.0 /100 | #83 | Exceptional 97.9% |
| Cypriots | 98.9 /100 | #84 | Exceptional 97.9% |
Demographics Similar to Venezuelans by 4th Grade
In terms of 4th grade, the demographic groups most similar to Venezuelans are Ugandan (97.6%, a difference of 0.0%), Apache (97.6%, a difference of 0.010%), Marshallese (97.6%, a difference of 0.010%), Bermudan (97.6%, a difference of 0.010%), and Immigrants from Iran (97.6%, a difference of 0.010%).
| Demographics | Rating | Rank | 4th Grade |
| French American Indians | 65.9 /100 | #158 | Good 97.6% |
| Immigrants | Italy | 63.7 /100 | #159 | Good 97.6% |
| Apache | 61.3 /100 | #160 | Good 97.6% |
| Marshallese | 60.8 /100 | #161 | Good 97.6% |
| Bermudans | 60.5 /100 | #162 | Good 97.6% |
| Immigrants | Iran | 60.3 /100 | #163 | Good 97.6% |
| Ugandans | 58.9 /100 | #164 | Average 97.6% |
| Venezuelans | 58.7 /100 | #165 | Average 97.6% |
| Kenyans | 56.5 /100 | #166 | Average 97.5% |
| Immigrants | Poland | 55.9 /100 | #167 | Average 97.5% |
| Immigrants | Belarus | 55.8 /100 | #168 | Average 97.5% |
| Chileans | 54.4 /100 | #169 | Average 97.5% |
| Immigrants | Spain | 51.8 /100 | #170 | Average 97.5% |
| Brazilians | 51.5 /100 | #171 | Average 97.5% |
| Immigrants | Sri Lanka | 51.1 /100 | #172 | Average 97.5% |