Immigrants from Lithuania vs Immigrants from Dominica Vision Disability
COMPARE
Immigrants from Lithuania
Immigrants from Dominica
Vision Disability
Vision Disability Comparison
Immigrants from Lithuania
Immigrants from Dominica
1.9%
VISION DISABILITY
99.9/ 100
METRIC RATING
24th/ 347
METRIC RANK
2.5%
VISION DISABILITY
0.0/ 100
METRIC RATING
297th/ 347
METRIC RANK
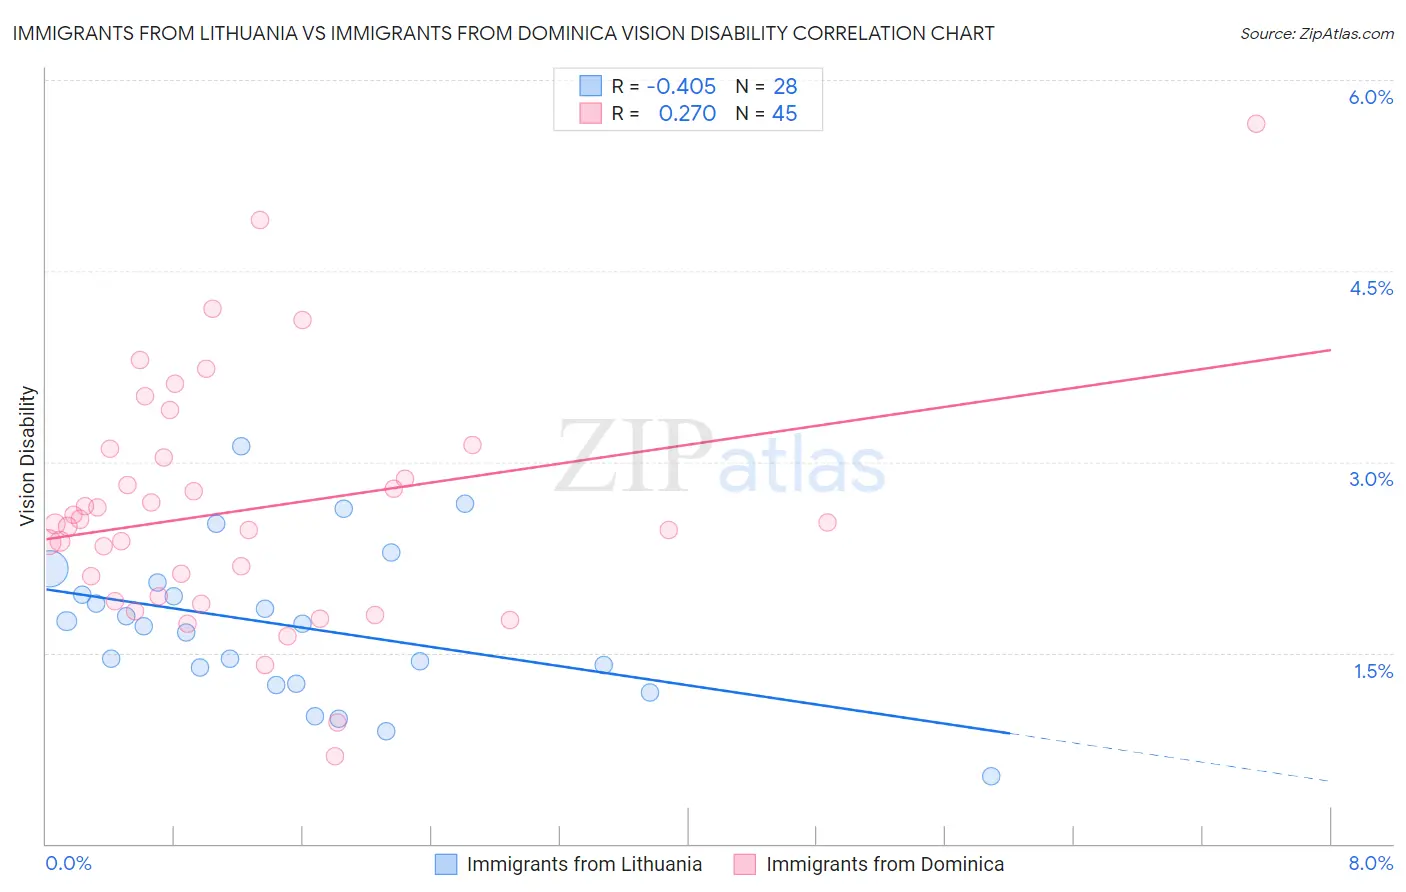
Immigrants from Lithuania vs Immigrants from Dominica Vision Disability Correlation Chart
The statistical analysis conducted on geographies consisting of 117,709,578 people shows a moderate negative correlation between the proportion of Immigrants from Lithuania and percentage of population with vision disability in the United States with a correlation coefficient (R) of -0.405 and weighted average of 1.9%. Similarly, the statistical analysis conducted on geographies consisting of 83,777,112 people shows a weak positive correlation between the proportion of Immigrants from Dominica and percentage of population with vision disability in the United States with a correlation coefficient (R) of 0.270 and weighted average of 2.5%, a difference of 31.8%.
Vision Disability Correlation Summary
| Measurement | Immigrants from Lithuania | Immigrants from Dominica |
| Minimum | 0.53% | 0.69% |
| Maximum | 3.1% | 5.7% |
| Range | 2.6% | 5.0% |
| Mean | 1.7% | 2.6% |
| Median | 1.7% | 2.5% |
| Interquartile 25% (IQ1) | 1.3% | 1.9% |
| Interquartile 75% (IQ3) | 2.0% | 3.1% |
| Interquartile Range (IQR) | 0.69% | 1.1% |
| Standard Deviation (Sample) | 0.59% | 0.95% |
| Standard Deviation (Population) | 0.58% | 0.94% |
Similar Demographics by Vision Disability
Demographics Similar to Immigrants from Lithuania by Vision Disability
In terms of vision disability, the demographic groups most similar to Immigrants from Lithuania are Bulgarian (1.9%, a difference of 0.040%), Immigrants from Japan (1.9%, a difference of 0.080%), Immigrants from Asia (1.9%, a difference of 0.12%), Taiwanese (1.9%, a difference of 0.41%), and Immigrants from Malaysia (1.9%, a difference of 0.44%).
| Demographics | Rating | Rank | Vision Disability |
| Burmese | 100.0 /100 | #17 | Exceptional 1.8% |
| Bolivians | 100.0 /100 | #18 | Exceptional 1.9% |
| Immigrants | Sri Lanka | 100.0 /100 | #19 | Exceptional 1.9% |
| Asians | 100.0 /100 | #20 | Exceptional 1.9% |
| Turks | 100.0 /100 | #21 | Exceptional 1.9% |
| Immigrants | Pakistan | 100.0 /100 | #22 | Exceptional 1.9% |
| Immigrants | Asia | 99.9 /100 | #23 | Exceptional 1.9% |
| Immigrants | Lithuania | 99.9 /100 | #24 | Exceptional 1.9% |
| Bulgarians | 99.9 /100 | #25 | Exceptional 1.9% |
| Immigrants | Japan | 99.9 /100 | #26 | Exceptional 1.9% |
| Taiwanese | 99.9 /100 | #27 | Exceptional 1.9% |
| Immigrants | Malaysia | 99.9 /100 | #28 | Exceptional 1.9% |
| Egyptians | 99.9 /100 | #29 | Exceptional 1.9% |
| Immigrants | Nepal | 99.9 /100 | #30 | Exceptional 1.9% |
| Mongolians | 99.9 /100 | #31 | Exceptional 1.9% |
Demographics Similar to Immigrants from Dominica by Vision Disability
In terms of vision disability, the demographic groups most similar to Immigrants from Dominica are Mexican (2.5%, a difference of 0.14%), Cree (2.5%, a difference of 0.17%), African (2.5%, a difference of 0.37%), Menominee (2.5%, a difference of 0.55%), and Immigrants from Mexico (2.5%, a difference of 0.68%).
| Demographics | Rating | Rank | Vision Disability |
| Immigrants | Cuba | 0.0 /100 | #290 | Tragic 2.5% |
| Immigrants | Honduras | 0.0 /100 | #291 | Tragic 2.5% |
| Crow | 0.0 /100 | #292 | Tragic 2.5% |
| Yaqui | 0.0 /100 | #293 | Tragic 2.5% |
| Ottawa | 0.0 /100 | #294 | Tragic 2.5% |
| Delaware | 0.0 /100 | #295 | Tragic 2.5% |
| Immigrants | Mexico | 0.0 /100 | #296 | Tragic 2.5% |
| Immigrants | Dominica | 0.0 /100 | #297 | Tragic 2.5% |
| Mexicans | 0.0 /100 | #298 | Tragic 2.5% |
| Cree | 0.0 /100 | #299 | Tragic 2.5% |
| Africans | 0.0 /100 | #300 | Tragic 2.5% |
| Menominee | 0.0 /100 | #301 | Tragic 2.5% |
| Spanish American Indians | 0.0 /100 | #302 | Tragic 2.6% |
| Immigrants | Cabo Verde | 0.0 /100 | #303 | Tragic 2.6% |
| Aleuts | 0.0 /100 | #304 | Tragic 2.6% |