Immigrants from Sierra Leone vs Guatemalan Disability Age 5 to 17
COMPARE
Immigrants from Sierra Leone
Guatemalan
Disability Age 5 to 17
Disability Age 5 to 17 Comparison
Immigrants from Sierra Leone
Guatemalans
5.8%
DISABILITY AGE 5 TO 17
7.1/ 100
METRIC RATING
218th/ 347
METRIC RANK
5.5%
DISABILITY AGE 5 TO 17
81.5/ 100
METRIC RATING
150th/ 347
METRIC RANK
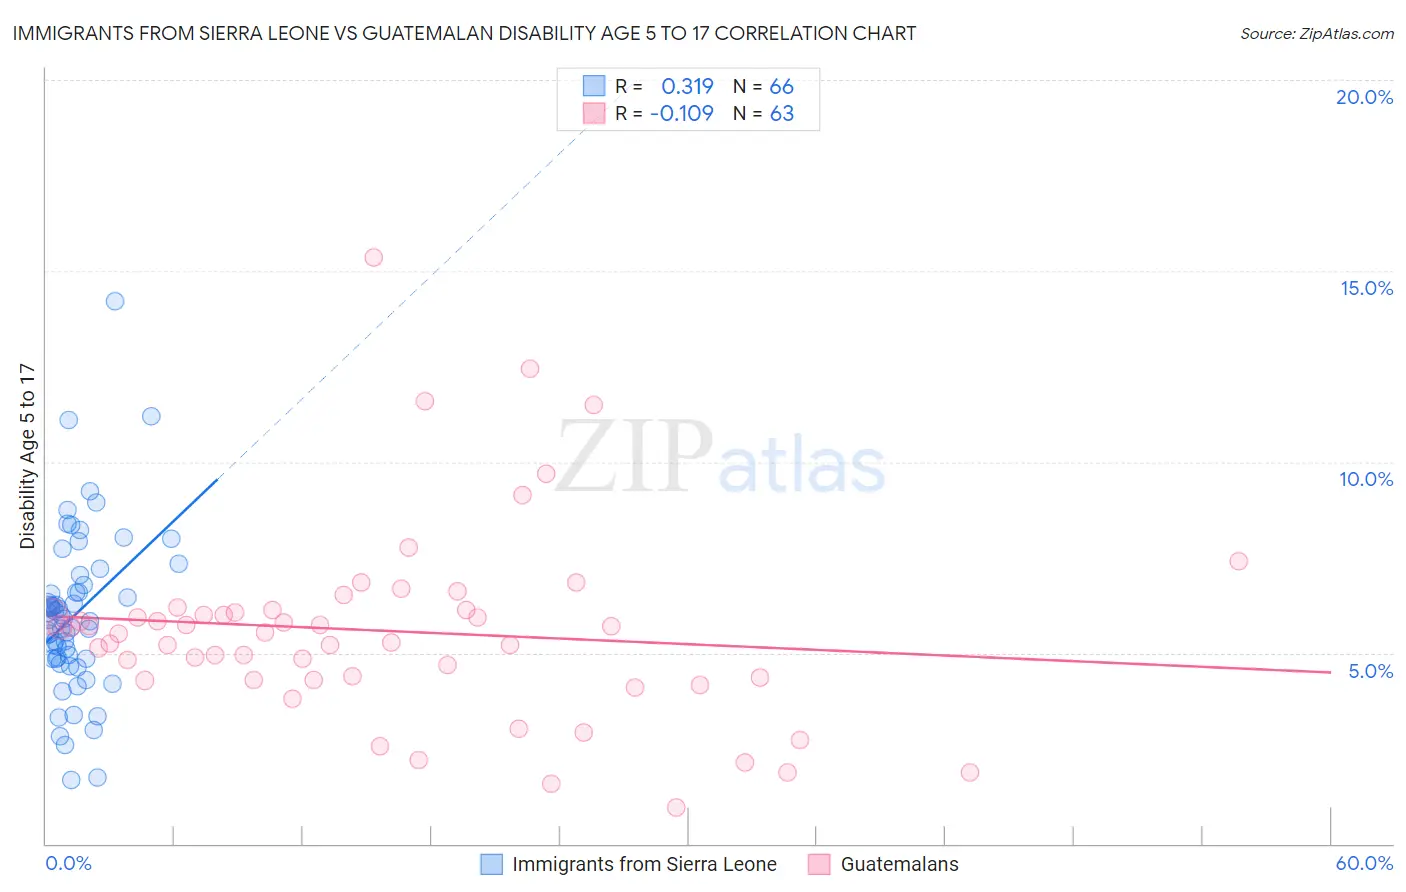
Immigrants from Sierra Leone vs Guatemalan Disability Age 5 to 17 Correlation Chart
The statistical analysis conducted on geographies consisting of 101,549,663 people shows a mild positive correlation between the proportion of Immigrants from Sierra Leone and percentage of population with a disability between the ages 5 and 17 in the United States with a correlation coefficient (R) of 0.319 and weighted average of 5.8%. Similarly, the statistical analysis conducted on geographies consisting of 406,988,204 people shows a poor negative correlation between the proportion of Guatemalans and percentage of population with a disability between the ages 5 and 17 in the United States with a correlation coefficient (R) of -0.109 and weighted average of 5.5%, a difference of 5.1%.
Disability Age 5 to 17 Correlation Summary
| Measurement | Immigrants from Sierra Leone | Guatemalan |
| Minimum | 1.7% | 0.96% |
| Maximum | 14.2% | 15.4% |
| Range | 12.5% | 14.4% |
| Mean | 6.0% | 5.6% |
| Median | 5.9% | 5.5% |
| Interquartile 25% (IQ1) | 4.8% | 4.3% |
| Interquartile 75% (IQ3) | 6.8% | 6.1% |
| Interquartile Range (IQR) | 1.9% | 1.8% |
| Standard Deviation (Sample) | 2.2% | 2.5% |
| Standard Deviation (Population) | 2.1% | 2.5% |
Similar Demographics by Disability Age 5 to 17
Demographics Similar to Immigrants from Sierra Leone by Disability Age 5 to 17
In terms of disability age 5 to 17, the demographic groups most similar to Immigrants from Sierra Leone are Sierra Leonean (5.8%, a difference of 0.010%), Belgian (5.8%, a difference of 0.030%), Czech (5.8%, a difference of 0.050%), Lithuanian (5.8%, a difference of 0.070%), and Immigrants from Sudan (5.8%, a difference of 0.070%).
| Demographics | Rating | Rank | Disability Age 5 to 17 |
| Yugoslavians | 9.1 /100 | #211 | Tragic 5.8% |
| Immigrants | Panama | 8.7 /100 | #212 | Tragic 5.8% |
| Immigrants | Cameroon | 8.3 /100 | #213 | Tragic 5.8% |
| Immigrants | Morocco | 8.3 /100 | #214 | Tragic 5.8% |
| Swedes | 8.1 /100 | #215 | Tragic 5.8% |
| Nigerians | 7.5 /100 | #216 | Tragic 5.8% |
| Czechs | 7.4 /100 | #217 | Tragic 5.8% |
| Immigrants | Sierra Leone | 7.1 /100 | #218 | Tragic 5.8% |
| Sierra Leoneans | 7.0 /100 | #219 | Tragic 5.8% |
| Belgians | 6.9 /100 | #220 | Tragic 5.8% |
| Lithuanians | 6.7 /100 | #221 | Tragic 5.8% |
| Immigrants | Sudan | 6.7 /100 | #222 | Tragic 5.8% |
| Alsatians | 6.0 /100 | #223 | Tragic 5.8% |
| Mexicans | 5.7 /100 | #224 | Tragic 5.8% |
| Guamanians/Chamorros | 5.6 /100 | #225 | Tragic 5.8% |
Demographics Similar to Guatemalans by Disability Age 5 to 17
In terms of disability age 5 to 17, the demographic groups most similar to Guatemalans are Central American (5.5%, a difference of 0.0%), Samoan (5.5%, a difference of 0.030%), Estonian (5.5%, a difference of 0.060%), Ute (5.5%, a difference of 0.070%), and Immigrants from Albania (5.5%, a difference of 0.13%).
| Demographics | Rating | Rank | Disability Age 5 to 17 |
| Immigrants | Hungary | 87.9 /100 | #143 | Excellent 5.5% |
| Pakistanis | 87.3 /100 | #144 | Excellent 5.5% |
| Immigrants | Guatemala | 86.6 /100 | #145 | Excellent 5.5% |
| Albanians | 83.7 /100 | #146 | Excellent 5.5% |
| Immigrants | Albania | 83.1 /100 | #147 | Excellent 5.5% |
| Samoans | 81.9 /100 | #148 | Excellent 5.5% |
| Central Americans | 81.6 /100 | #149 | Excellent 5.5% |
| Guatemalans | 81.5 /100 | #150 | Excellent 5.5% |
| Estonians | 80.8 /100 | #151 | Excellent 5.5% |
| Ute | 80.6 /100 | #152 | Excellent 5.5% |
| Ecuadorians | 79.7 /100 | #153 | Good 5.5% |
| Australians | 78.8 /100 | #154 | Good 5.5% |
| Immigrants | Ecuador | 78.3 /100 | #155 | Good 5.5% |
| Hawaiians | 78.0 /100 | #156 | Good 5.5% |
| Immigrants | Costa Rica | 77.9 /100 | #157 | Good 5.5% |