Guyanese vs Nigerian Vision Disability
COMPARE
Guyanese
Nigerian
Vision Disability
Vision Disability Comparison
Guyanese
Nigerians
2.2%
VISION DISABILITY
28.9/ 100
METRIC RATING
188th/ 347
METRIC RANK
2.3%
VISION DISABILITY
7.2/ 100
METRIC RATING
215th/ 347
METRIC RANK
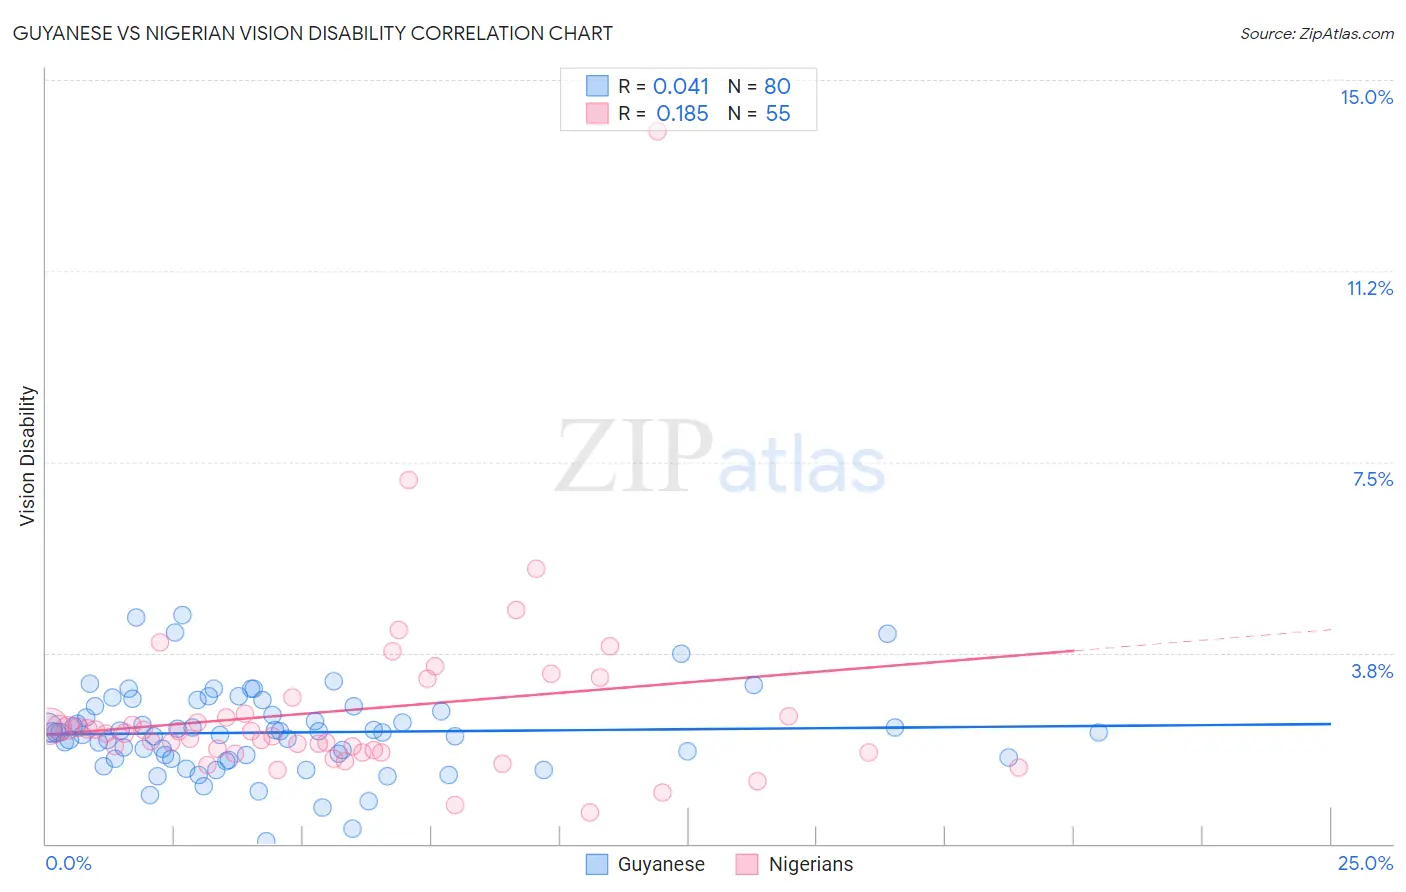
Guyanese vs Nigerian Vision Disability Correlation Chart
The statistical analysis conducted on geographies consisting of 176,846,662 people shows no correlation between the proportion of Guyanese and percentage of population with vision disability in the United States with a correlation coefficient (R) of 0.041 and weighted average of 2.2%. Similarly, the statistical analysis conducted on geographies consisting of 332,578,519 people shows a poor positive correlation between the proportion of Nigerians and percentage of population with vision disability in the United States with a correlation coefficient (R) of 0.185 and weighted average of 2.3%, a difference of 2.6%.
Vision Disability Correlation Summary
| Measurement | Guyanese | Nigerian |
| Minimum | 0.061% | 0.62% |
| Maximum | 4.5% | 14.0% |
| Range | 4.4% | 13.4% |
| Mean | 2.2% | 2.6% |
| Median | 2.2% | 2.2% |
| Interquartile 25% (IQ1) | 1.7% | 1.8% |
| Interquartile 75% (IQ3) | 2.6% | 2.5% |
| Interquartile Range (IQR) | 0.97% | 0.74% |
| Standard Deviation (Sample) | 0.83% | 1.9% |
| Standard Deviation (Population) | 0.82% | 1.9% |
Similar Demographics by Vision Disability
Demographics Similar to Guyanese by Vision Disability
In terms of vision disability, the demographic groups most similar to Guyanese are Immigrants from St. Vincent and the Grenadines (2.2%, a difference of 0.11%), Salvadoran (2.2%, a difference of 0.11%), Immigrants from Costa Rica (2.2%, a difference of 0.22%), Canadian (2.2%, a difference of 0.24%), and European (2.2%, a difference of 0.24%).
| Demographics | Rating | Rank | Vision Disability |
| Immigrants | Western Europe | 41.1 /100 | #181 | Average 2.2% |
| Costa Ricans | 40.7 /100 | #182 | Average 2.2% |
| Immigrants | Burma/Myanmar | 37.9 /100 | #183 | Fair 2.2% |
| Moroccans | 35.4 /100 | #184 | Fair 2.2% |
| Immigrants | Middle Africa | 33.5 /100 | #185 | Fair 2.2% |
| Native Hawaiians | 33.3 /100 | #186 | Fair 2.2% |
| Immigrants | St. Vincent and the Grenadines | 30.3 /100 | #187 | Fair 2.2% |
| Guyanese | 28.9 /100 | #188 | Fair 2.2% |
| Salvadorans | 27.4 /100 | #189 | Fair 2.2% |
| Immigrants | Costa Rica | 26.1 /100 | #190 | Fair 2.2% |
| Canadians | 25.8 /100 | #191 | Fair 2.2% |
| Europeans | 25.7 /100 | #192 | Fair 2.2% |
| British | 25.1 /100 | #193 | Fair 2.2% |
| Immigrants | Barbados | 24.0 /100 | #194 | Fair 2.2% |
| Immigrants | Immigrants | 23.7 /100 | #195 | Fair 2.2% |
Demographics Similar to Nigerians by Vision Disability
In terms of vision disability, the demographic groups most similar to Nigerians are Trinidadian and Tobagonian (2.2%, a difference of 0.21%), Immigrants from Trinidad and Tobago (2.3%, a difference of 0.29%), Immigrants from Ghana (2.2%, a difference of 0.34%), Bermudan (2.2%, a difference of 0.35%), and Indonesian (2.2%, a difference of 0.44%).
| Demographics | Rating | Rank | Vision Disability |
| Germans | 13.4 /100 | #208 | Poor 2.2% |
| Immigrants | Brazil | 13.1 /100 | #209 | Poor 2.2% |
| Immigrants | Uruguay | 11.5 /100 | #210 | Poor 2.2% |
| Indonesians | 9.5 /100 | #211 | Tragic 2.2% |
| Bermudans | 9.0 /100 | #212 | Tragic 2.2% |
| Immigrants | Ghana | 8.9 /100 | #213 | Tragic 2.2% |
| Trinidadians and Tobagonians | 8.2 /100 | #214 | Tragic 2.2% |
| Nigerians | 7.2 /100 | #215 | Tragic 2.3% |
| Immigrants | Trinidad and Tobago | 6.1 /100 | #216 | Tragic 2.3% |
| Barbadians | 5.1 /100 | #217 | Tragic 2.3% |
| Portuguese | 4.9 /100 | #218 | Tragic 2.3% |
| Ecuadorians | 4.6 /100 | #219 | Tragic 2.3% |
| Guamanians/Chamorros | 3.9 /100 | #220 | Tragic 2.3% |
| French Canadians | 3.9 /100 | #221 | Tragic 2.3% |
| Immigrants | Senegal | 3.8 /100 | #222 | Tragic 2.3% |