Immigrants from Fiji vs Nigerian Vision Disability
COMPARE
Immigrants from Fiji
Nigerian
Vision Disability
Vision Disability Comparison
Immigrants from Fiji
Nigerians
2.2%
VISION DISABILITY
47.6/ 100
METRIC RATING
175th/ 347
METRIC RANK
2.3%
VISION DISABILITY
7.2/ 100
METRIC RATING
215th/ 347
METRIC RANK
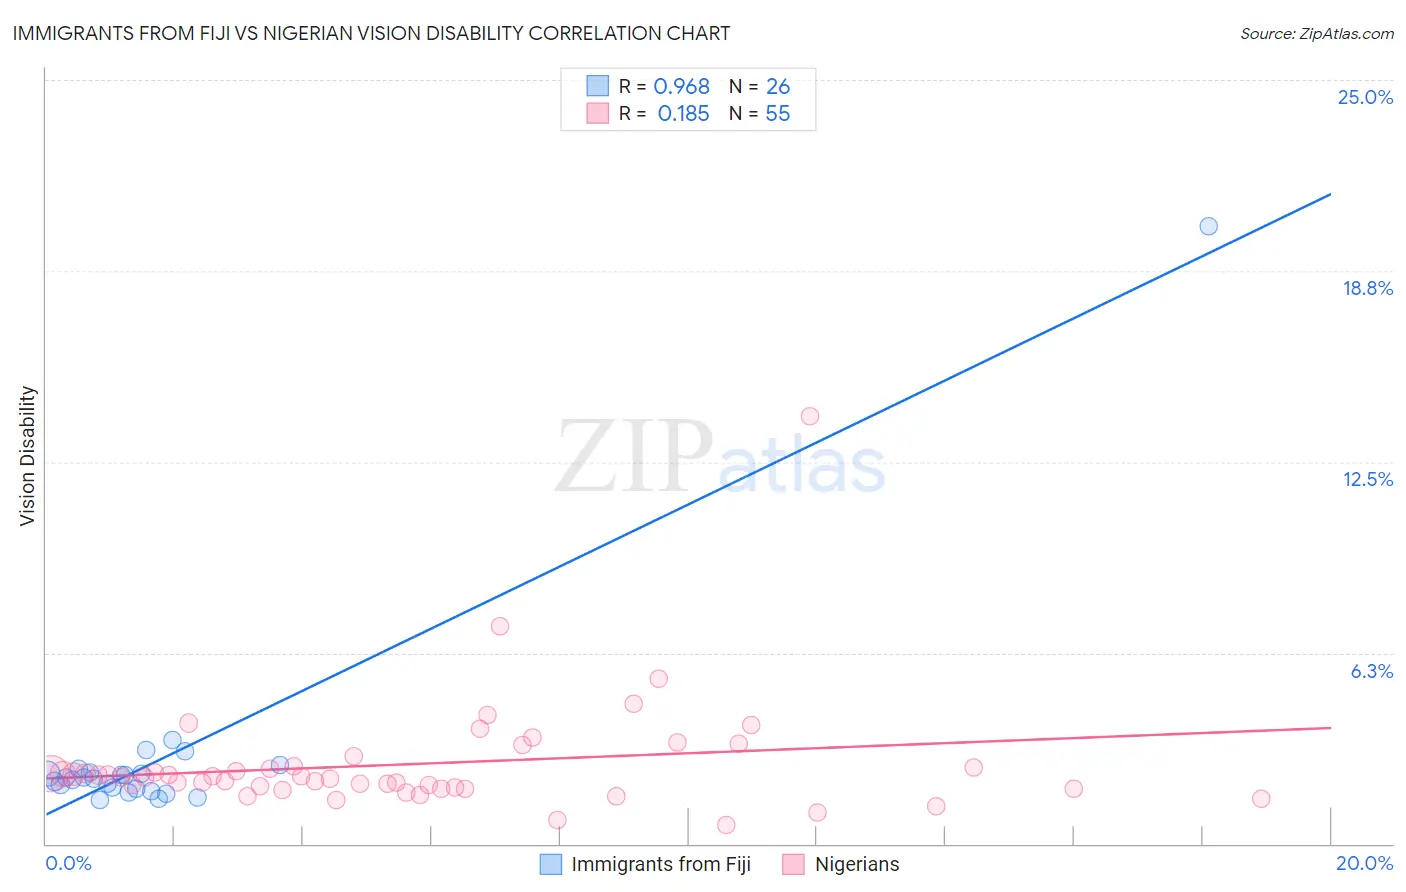
Immigrants from Fiji vs Nigerian Vision Disability Correlation Chart
The statistical analysis conducted on geographies consisting of 93,750,153 people shows a perfect positive correlation between the proportion of Immigrants from Fiji and percentage of population with vision disability in the United States with a correlation coefficient (R) of 0.968 and weighted average of 2.2%. Similarly, the statistical analysis conducted on geographies consisting of 332,578,519 people shows a poor positive correlation between the proportion of Nigerians and percentage of population with vision disability in the United States with a correlation coefficient (R) of 0.185 and weighted average of 2.3%, a difference of 3.9%.
Vision Disability Correlation Summary
| Measurement | Immigrants from Fiji | Nigerian |
| Minimum | 1.4% | 0.62% |
| Maximum | 20.2% | 14.0% |
| Range | 18.8% | 13.4% |
| Mean | 2.8% | 2.6% |
| Median | 2.1% | 2.2% |
| Interquartile 25% (IQ1) | 1.8% | 1.8% |
| Interquartile 75% (IQ3) | 2.4% | 2.5% |
| Interquartile Range (IQR) | 0.56% | 0.74% |
| Standard Deviation (Sample) | 3.6% | 1.9% |
| Standard Deviation (Population) | 3.5% | 1.9% |
Similar Demographics by Vision Disability
Demographics Similar to Immigrants from Fiji by Vision Disability
In terms of vision disability, the demographic groups most similar to Immigrants from Fiji are Yugoslavian (2.2%, a difference of 0.070%), Slavic (2.2%, a difference of 0.11%), Scandinavian (2.2%, a difference of 0.15%), Immigrants from Canada (2.2%, a difference of 0.15%), and Northern European (2.2%, a difference of 0.16%).
| Demographics | Rating | Rank | Vision Disability |
| Brazilians | 62.2 /100 | #168 | Good 2.1% |
| South American Indians | 57.4 /100 | #169 | Average 2.2% |
| Swiss | 55.7 /100 | #170 | Average 2.2% |
| Lebanese | 54.3 /100 | #171 | Average 2.2% |
| Northern Europeans | 50.1 /100 | #172 | Average 2.2% |
| Scandinavians | 50.0 /100 | #173 | Average 2.2% |
| Immigrants | Canada | 50.0 /100 | #174 | Average 2.2% |
| Immigrants | Fiji | 47.6 /100 | #175 | Average 2.2% |
| Yugoslavians | 46.5 /100 | #176 | Average 2.2% |
| Slavs | 46.0 /100 | #177 | Average 2.2% |
| Immigrants | Oceania | 45.1 /100 | #178 | Average 2.2% |
| Immigrants | North America | 44.5 /100 | #179 | Average 2.2% |
| Uruguayans | 42.7 /100 | #180 | Average 2.2% |
| Immigrants | Western Europe | 41.1 /100 | #181 | Average 2.2% |
| Costa Ricans | 40.7 /100 | #182 | Average 2.2% |
Demographics Similar to Nigerians by Vision Disability
In terms of vision disability, the demographic groups most similar to Nigerians are Trinidadian and Tobagonian (2.2%, a difference of 0.21%), Immigrants from Trinidad and Tobago (2.3%, a difference of 0.29%), Immigrants from Ghana (2.2%, a difference of 0.34%), Bermudan (2.2%, a difference of 0.35%), and Indonesian (2.2%, a difference of 0.44%).
| Demographics | Rating | Rank | Vision Disability |
| Germans | 13.4 /100 | #208 | Poor 2.2% |
| Immigrants | Brazil | 13.1 /100 | #209 | Poor 2.2% |
| Immigrants | Uruguay | 11.5 /100 | #210 | Poor 2.2% |
| Indonesians | 9.5 /100 | #211 | Tragic 2.2% |
| Bermudans | 9.0 /100 | #212 | Tragic 2.2% |
| Immigrants | Ghana | 8.9 /100 | #213 | Tragic 2.2% |
| Trinidadians and Tobagonians | 8.2 /100 | #214 | Tragic 2.2% |
| Nigerians | 7.2 /100 | #215 | Tragic 2.3% |
| Immigrants | Trinidad and Tobago | 6.1 /100 | #216 | Tragic 2.3% |
| Barbadians | 5.1 /100 | #217 | Tragic 2.3% |
| Portuguese | 4.9 /100 | #218 | Tragic 2.3% |
| Ecuadorians | 4.6 /100 | #219 | Tragic 2.3% |
| Guamanians/Chamorros | 3.9 /100 | #220 | Tragic 2.3% |
| French Canadians | 3.9 /100 | #221 | Tragic 2.3% |
| Immigrants | Senegal | 3.8 /100 | #222 | Tragic 2.3% |