Immigrants from Latin America vs Yup'ik Disability Age Over 75
COMPARE
Immigrants from Latin America
Yup'ik
Disability Age Over 75
Disability Age Over 75 Comparison
Immigrants from Latin America
Yup'ik
49.5%
DISABILITY AGE OVER 75
0.0/ 100
METRIC RATING
284th/ 347
METRIC RANK
61.1%
DISABILITY AGE OVER 75
0.0/ 100
METRIC RATING
347th/ 347
METRIC RANK
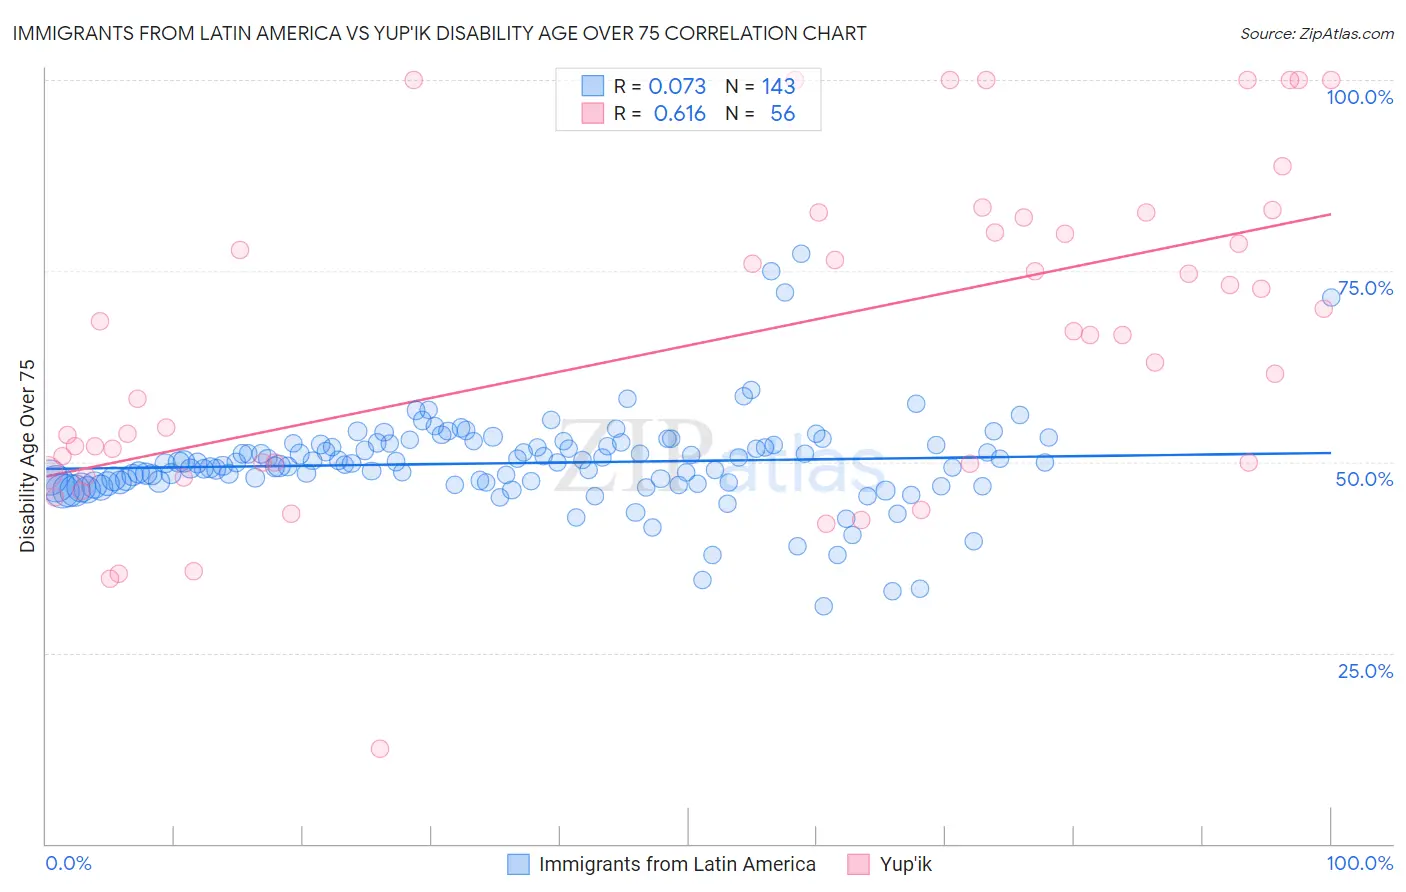
Immigrants from Latin America vs Yup'ik Disability Age Over 75 Correlation Chart
The statistical analysis conducted on geographies consisting of 556,620,542 people shows a slight positive correlation between the proportion of Immigrants from Latin America and percentage of population with a disability over the age of 75 in the United States with a correlation coefficient (R) of 0.073 and weighted average of 49.5%. Similarly, the statistical analysis conducted on geographies consisting of 39,925,791 people shows a significant positive correlation between the proportion of Yup'ik and percentage of population with a disability over the age of 75 in the United States with a correlation coefficient (R) of 0.616 and weighted average of 61.1%, a difference of 23.4%.
Disability Age Over 75 Correlation Summary
| Measurement | Immigrants from Latin America | Yup'ik |
| Minimum | 31.1% | 12.5% |
| Maximum | 77.2% | 100.0% |
| Range | 46.1% | 87.5% |
| Mean | 49.8% | 65.7% |
| Median | 49.8% | 66.7% |
| Interquartile 25% (IQ1) | 47.2% | 49.8% |
| Interquartile 75% (IQ3) | 52.3% | 81.0% |
| Interquartile Range (IQR) | 5.1% | 31.2% |
| Standard Deviation (Sample) | 6.3% | 21.0% |
| Standard Deviation (Population) | 6.2% | 20.8% |
Similar Demographics by Disability Age Over 75
Demographics Similar to Immigrants from Latin America by Disability Age Over 75
In terms of disability age over 75, the demographic groups most similar to Immigrants from Latin America are Samoan (49.5%, a difference of 0.050%), Black/African American (49.5%, a difference of 0.080%), Crow (49.6%, a difference of 0.13%), Belizean (49.4%, a difference of 0.22%), and Immigrants from Belize (49.6%, a difference of 0.22%).
| Demographics | Rating | Rank | Disability Age Over 75 |
| Hawaiians | 0.1 /100 | #277 | Tragic 49.2% |
| Immigrants | Laos | 0.1 /100 | #278 | Tragic 49.2% |
| Guamanians/Chamorros | 0.0 /100 | #279 | Tragic 49.4% |
| Bangladeshis | 0.0 /100 | #280 | Tragic 49.4% |
| Belizeans | 0.0 /100 | #281 | Tragic 49.4% |
| Blacks/African Americans | 0.0 /100 | #282 | Tragic 49.5% |
| Samoans | 0.0 /100 | #283 | Tragic 49.5% |
| Immigrants | Latin America | 0.0 /100 | #284 | Tragic 49.5% |
| Crow | 0.0 /100 | #285 | Tragic 49.6% |
| Immigrants | Belize | 0.0 /100 | #286 | Tragic 49.6% |
| Sioux | 0.0 /100 | #287 | Tragic 49.7% |
| Yaqui | 0.0 /100 | #288 | Tragic 49.8% |
| Osage | 0.0 /100 | #289 | Tragic 49.8% |
| Puget Sound Salish | 0.0 /100 | #290 | Tragic 49.8% |
| Arapaho | 0.0 /100 | #291 | Tragic 49.8% |
Demographics Similar to Yup'ik by Disability Age Over 75
In terms of disability age over 75, the demographic groups most similar to Yup'ik are Tsimshian (59.2%, a difference of 3.2%), Inupiat (58.4%, a difference of 4.6%), Navajo (58.3%, a difference of 4.9%), Tohono O'odham (56.7%, a difference of 7.7%), and Lumbee (56.2%, a difference of 8.6%).
| Demographics | Rating | Rank | Disability Age Over 75 |
| Apache | 0.0 /100 | #333 | Tragic 53.6% |
| Alaskan Athabascans | 0.0 /100 | #334 | Tragic 54.0% |
| Kiowa | 0.0 /100 | #335 | Tragic 54.2% |
| Immigrants | Armenia | 0.0 /100 | #336 | Tragic 54.3% |
| Yuman | 0.0 /100 | #337 | Tragic 54.4% |
| Colville | 0.0 /100 | #338 | Tragic 55.4% |
| Pima | 0.0 /100 | #339 | Tragic 55.8% |
| Pueblo | 0.0 /100 | #340 | Tragic 55.9% |
| Houma | 0.0 /100 | #341 | Tragic 56.2% |
| Lumbee | 0.0 /100 | #342 | Tragic 56.2% |
| Tohono O'odham | 0.0 /100 | #343 | Tragic 56.7% |
| Navajo | 0.0 /100 | #344 | Tragic 58.3% |
| Inupiat | 0.0 /100 | #345 | Tragic 58.4% |
| Tsimshian | 0.0 /100 | #346 | Tragic 59.2% |
| Yup'ik | 0.0 /100 | #347 | Tragic 61.1% |