Pakistani vs Yup'ik Disability Age Over 75
COMPARE
Pakistani
Yup'ik
Disability Age Over 75
Disability Age Over 75 Comparison
Pakistanis
Yup'ik
47.7%
DISABILITY AGE OVER 75
23.4/ 100
METRIC RATING
197th/ 347
METRIC RANK
61.1%
DISABILITY AGE OVER 75
0.0/ 100
METRIC RATING
347th/ 347
METRIC RANK
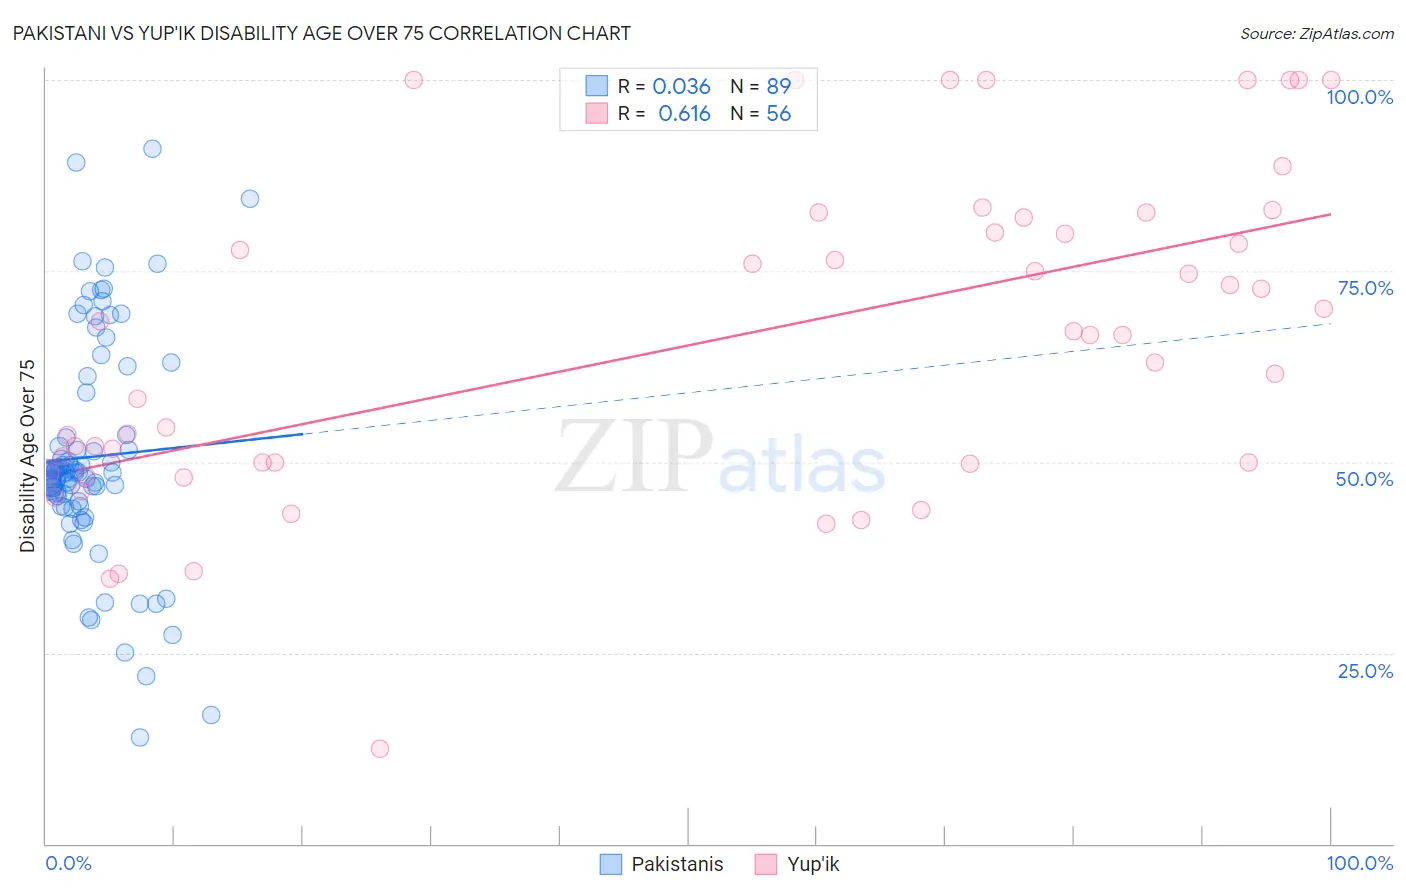
Pakistani vs Yup'ik Disability Age Over 75 Correlation Chart
The statistical analysis conducted on geographies consisting of 334,776,547 people shows no correlation between the proportion of Pakistanis and percentage of population with a disability over the age of 75 in the United States with a correlation coefficient (R) of 0.036 and weighted average of 47.7%. Similarly, the statistical analysis conducted on geographies consisting of 39,925,791 people shows a significant positive correlation between the proportion of Yup'ik and percentage of population with a disability over the age of 75 in the United States with a correlation coefficient (R) of 0.616 and weighted average of 61.1%, a difference of 28.2%.
Disability Age Over 75 Correlation Summary
| Measurement | Pakistani | Yup'ik |
| Minimum | 14.0% | 12.5% |
| Maximum | 91.0% | 100.0% |
| Range | 77.0% | 87.5% |
| Mean | 50.7% | 65.7% |
| Median | 48.4% | 66.7% |
| Interquartile 25% (IQ1) | 44.6% | 49.8% |
| Interquartile 75% (IQ3) | 56.3% | 81.0% |
| Interquartile Range (IQR) | 11.7% | 31.2% |
| Standard Deviation (Sample) | 14.7% | 21.0% |
| Standard Deviation (Population) | 14.6% | 20.8% |
Similar Demographics by Disability Age Over 75
Demographics Similar to Pakistanis by Disability Age Over 75
In terms of disability age over 75, the demographic groups most similar to Pakistanis are Immigrants from Portugal (47.6%, a difference of 0.010%), Immigrants from Ukraine (47.7%, a difference of 0.010%), Immigrants from Eritrea (47.7%, a difference of 0.030%), Immigrants from Trinidad and Tobago (47.6%, a difference of 0.060%), and Immigrants from Somalia (47.7%, a difference of 0.070%).
| Demographics | Rating | Rank | Disability Age Over 75 |
| Somalis | 29.5 /100 | #190 | Fair 47.6% |
| Portuguese | 29.3 /100 | #191 | Fair 47.6% |
| Immigrants | Jamaica | 28.3 /100 | #192 | Fair 47.6% |
| Ottawa | 28.1 /100 | #193 | Fair 47.6% |
| Immigrants | Lebanon | 26.5 /100 | #194 | Fair 47.6% |
| Immigrants | Trinidad and Tobago | 25.3 /100 | #195 | Fair 47.6% |
| Immigrants | Portugal | 23.8 /100 | #196 | Fair 47.6% |
| Pakistanis | 23.4 /100 | #197 | Fair 47.7% |
| Immigrants | Ukraine | 23.2 /100 | #198 | Fair 47.7% |
| Immigrants | Eritrea | 22.4 /100 | #199 | Fair 47.7% |
| Immigrants | Somalia | 21.4 /100 | #200 | Fair 47.7% |
| Immigrants | Cuba | 20.9 /100 | #201 | Fair 47.7% |
| Immigrants | Bahamas | 20.7 /100 | #202 | Fair 47.7% |
| Trinidadians and Tobagonians | 20.0 /100 | #203 | Fair 47.7% |
| Nigerians | 19.2 /100 | #204 | Poor 47.7% |
Demographics Similar to Yup'ik by Disability Age Over 75
In terms of disability age over 75, the demographic groups most similar to Yup'ik are Tsimshian (59.2%, a difference of 3.2%), Inupiat (58.4%, a difference of 4.6%), Navajo (58.3%, a difference of 4.9%), Tohono O'odham (56.7%, a difference of 7.7%), and Lumbee (56.2%, a difference of 8.6%).
| Demographics | Rating | Rank | Disability Age Over 75 |
| Apache | 0.0 /100 | #333 | Tragic 53.6% |
| Alaskan Athabascans | 0.0 /100 | #334 | Tragic 54.0% |
| Kiowa | 0.0 /100 | #335 | Tragic 54.2% |
| Immigrants | Armenia | 0.0 /100 | #336 | Tragic 54.3% |
| Yuman | 0.0 /100 | #337 | Tragic 54.4% |
| Colville | 0.0 /100 | #338 | Tragic 55.4% |
| Pima | 0.0 /100 | #339 | Tragic 55.8% |
| Pueblo | 0.0 /100 | #340 | Tragic 55.9% |
| Houma | 0.0 /100 | #341 | Tragic 56.2% |
| Lumbee | 0.0 /100 | #342 | Tragic 56.2% |
| Tohono O'odham | 0.0 /100 | #343 | Tragic 56.7% |
| Navajo | 0.0 /100 | #344 | Tragic 58.3% |
| Inupiat | 0.0 /100 | #345 | Tragic 58.4% |
| Tsimshian | 0.0 /100 | #346 | Tragic 59.2% |
| Yup'ik | 0.0 /100 | #347 | Tragic 61.1% |