Peruvian vs Yup'ik Disability Age Over 75
COMPARE
Peruvian
Yup'ik
Disability Age Over 75
Disability Age Over 75 Comparison
Peruvians
Yup'ik
46.8%
DISABILITY AGE OVER 75
86.5/ 100
METRIC RATING
142nd/ 347
METRIC RANK
61.1%
DISABILITY AGE OVER 75
0.0/ 100
METRIC RATING
347th/ 347
METRIC RANK
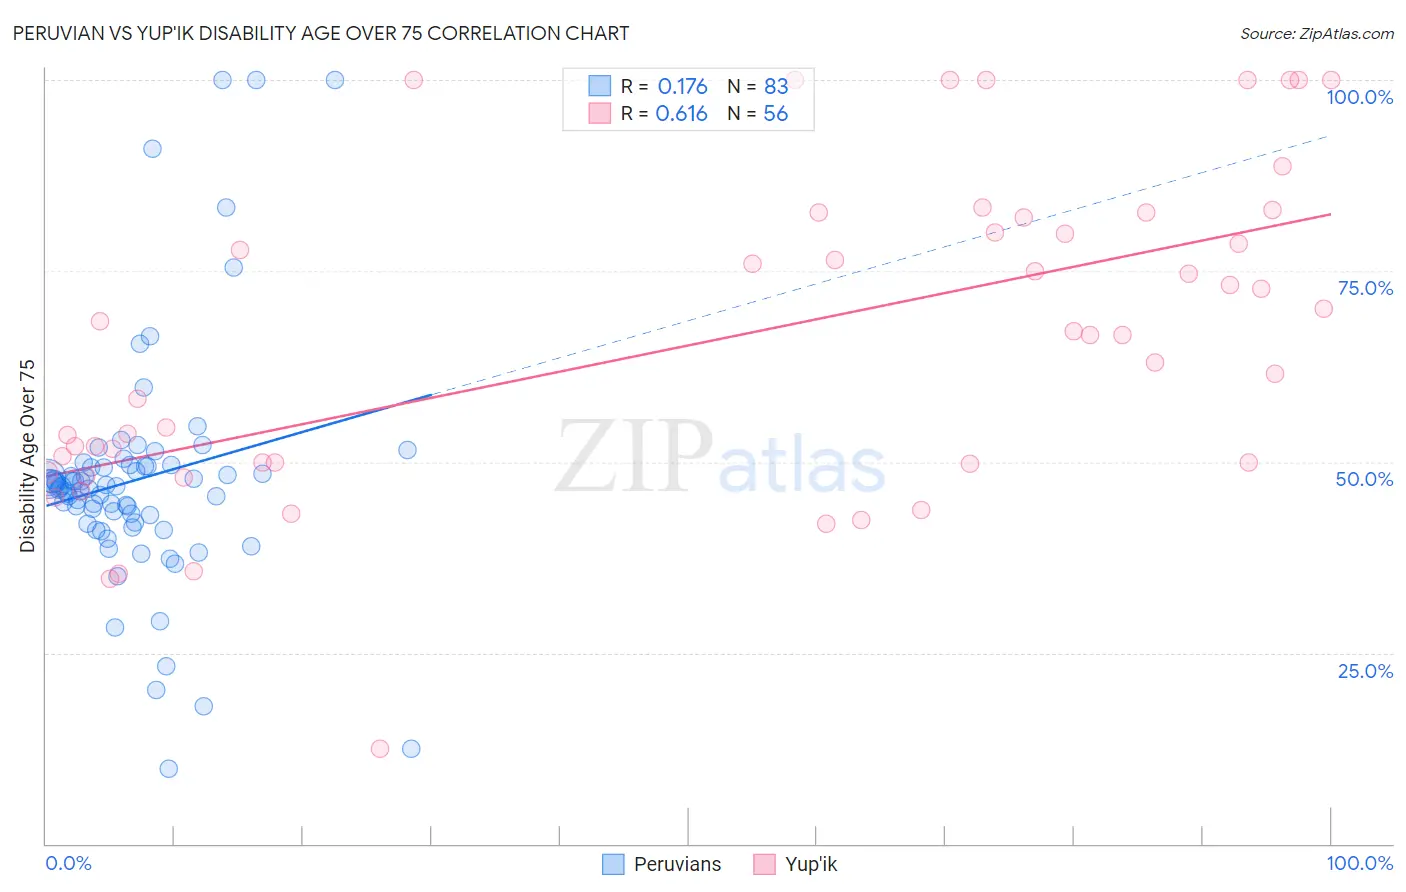
Peruvian vs Yup'ik Disability Age Over 75 Correlation Chart
The statistical analysis conducted on geographies consisting of 362,503,008 people shows a poor positive correlation between the proportion of Peruvians and percentage of population with a disability over the age of 75 in the United States with a correlation coefficient (R) of 0.176 and weighted average of 46.8%. Similarly, the statistical analysis conducted on geographies consisting of 39,925,791 people shows a significant positive correlation between the proportion of Yup'ik and percentage of population with a disability over the age of 75 in the United States with a correlation coefficient (R) of 0.616 and weighted average of 61.1%, a difference of 30.4%.
Disability Age Over 75 Correlation Summary
| Measurement | Peruvian | Yup'ik |
| Minimum | 9.9% | 12.5% |
| Maximum | 100.0% | 100.0% |
| Range | 90.1% | 87.5% |
| Mean | 47.6% | 65.7% |
| Median | 46.8% | 66.7% |
| Interquartile 25% (IQ1) | 42.1% | 49.8% |
| Interquartile 75% (IQ3) | 49.4% | 81.0% |
| Interquartile Range (IQR) | 7.3% | 31.2% |
| Standard Deviation (Sample) | 15.6% | 21.0% |
| Standard Deviation (Population) | 15.5% | 20.8% |
Similar Demographics by Disability Age Over 75
Demographics Similar to Peruvians by Disability Age Over 75
In terms of disability age over 75, the demographic groups most similar to Peruvians are Lebanese (46.8%, a difference of 0.020%), Bermudan (46.9%, a difference of 0.040%), Immigrants from Costa Rica (46.8%, a difference of 0.050%), Venezuelan (46.9%, a difference of 0.070%), and Costa Rican (46.9%, a difference of 0.090%).
| Demographics | Rating | Rank | Disability Age Over 75 |
| Ethiopians | 88.9 /100 | #135 | Excellent 46.8% |
| Immigrants | Venezuela | 88.6 /100 | #136 | Excellent 46.8% |
| Immigrants | Uganda | 88.5 /100 | #137 | Excellent 46.8% |
| Immigrants | Bosnia and Herzegovina | 88.5 /100 | #138 | Excellent 46.8% |
| Yugoslavians | 88.5 /100 | #139 | Excellent 46.8% |
| Immigrants | Costa Rica | 87.4 /100 | #140 | Excellent 46.8% |
| Lebanese | 87.0 /100 | #141 | Excellent 46.8% |
| Peruvians | 86.5 /100 | #142 | Excellent 46.8% |
| Bermudans | 85.6 /100 | #143 | Excellent 46.9% |
| Venezuelans | 85.0 /100 | #144 | Excellent 46.9% |
| Costa Ricans | 84.5 /100 | #145 | Excellent 46.9% |
| Guyanese | 84.3 /100 | #146 | Excellent 46.9% |
| Immigrants | Peru | 84.1 /100 | #147 | Excellent 46.9% |
| Asians | 81.6 /100 | #148 | Excellent 46.9% |
| Welsh | 81.3 /100 | #149 | Excellent 47.0% |
Demographics Similar to Yup'ik by Disability Age Over 75
In terms of disability age over 75, the demographic groups most similar to Yup'ik are Tsimshian (59.2%, a difference of 3.2%), Inupiat (58.4%, a difference of 4.6%), Navajo (58.3%, a difference of 4.9%), Tohono O'odham (56.7%, a difference of 7.7%), and Lumbee (56.2%, a difference of 8.6%).
| Demographics | Rating | Rank | Disability Age Over 75 |
| Apache | 0.0 /100 | #333 | Tragic 53.6% |
| Alaskan Athabascans | 0.0 /100 | #334 | Tragic 54.0% |
| Kiowa | 0.0 /100 | #335 | Tragic 54.2% |
| Immigrants | Armenia | 0.0 /100 | #336 | Tragic 54.3% |
| Yuman | 0.0 /100 | #337 | Tragic 54.4% |
| Colville | 0.0 /100 | #338 | Tragic 55.4% |
| Pima | 0.0 /100 | #339 | Tragic 55.8% |
| Pueblo | 0.0 /100 | #340 | Tragic 55.9% |
| Houma | 0.0 /100 | #341 | Tragic 56.2% |
| Lumbee | 0.0 /100 | #342 | Tragic 56.2% |
| Tohono O'odham | 0.0 /100 | #343 | Tragic 56.7% |
| Navajo | 0.0 /100 | #344 | Tragic 58.3% |
| Inupiat | 0.0 /100 | #345 | Tragic 58.4% |
| Tsimshian | 0.0 /100 | #346 | Tragic 59.2% |
| Yup'ik | 0.0 /100 | #347 | Tragic 61.1% |